The next monetary policy announcement is due in the last week of May 2010. We attempt to forecast the cut in the policy discount rate by looking at oil prices, the relationship between oil prices and imports, exports, remittances, the current account balance, net foreign assets, credit to the private sector and public sector enterprises, net government borrowing, M2 growth and the relationship with core inflation and finally the relationship between core inflation and the policy discount rate. The results obtained from the model are then viewed in light of the emerging trend between 3-month T-Bill yields relative to the policy discount rate. Based on this observation the cut in the policy discount rate is estimated.
Factors impacting the policy discount rate
Our model for predicting the direction and extent of the monetary policy on 24th May 2010 is based on the following factors.
The primary driver in the model is crude oil prices. From the estimated trend in oil prices, we predict what Imports will be. This will further impact the Balance of Trade, Current Account balance, Net Foreign Assets, M2, inflation and finally the policy discount rate.
In addition to oil prices we look at:
- Workers remittances and its relationships with net current transfers;
- Exports, which together with imports will be used to determine the balance of trade;
- Net balance of trade in services and net income balance which together with the balance of trade and net current transfers will be used to determine the current account balance and by definition of net foreign assets the increase/ decrease in NFA for the fiscal year;
- Net government sector borrowing, credit to the private sector and credit to PSE which together with NFA and the relationship of these four elements with M2 over time will be used to estimate M2 for the period.
- Relationship between year on year core inflation and year on year M2 growth to discern what core inflation will be like as well as the relationship between core inflation and CPI and subsequently the relationship between CPI and WPI and SPI respectively to determine what these inflation figures will read like.
- Relationship between core inflation and the policy discount rate to determine the direction and extent of the monetary policy statement on May 24th 2010.
Separately we look at the relationship between the policy discount rate and the 3-month Treasury bill yield from the auction profile to ascertain what the market feeling is regarding the monetary policy announcement and whether the conclusions we derive from the model are also suggested by the trends of the policy discount rate and T-Bill yield.
Baseline results
Oil prices and Imports
We started off by forecasting the Brent crude oil spot prices for the period 19th May 2010 to the end of FY 2010. Average prices for the months of May and June 2010 respectively for the baseline scenario are given in the table below. These are based on the current trends and volatilities in crude oil prices.
| BRENT CRUDE OIL SPOT PRICES | USD PER BARREL | IMPORTS (THOUSAND USD) |
| May average price | 74.14 | 2,449,485.74 |
| June average price | 69.68 | 2,335,667.62 |
We have assumed that the principal factor driving the imports figure is the oil price. This seems logical as Pakistan’s oil imports bill accounts for the largest proportion of total imports, nearly a third of the total import payments made which suggests a high correlation between the import payments and crude oil prices. This can be seen in the graph below:
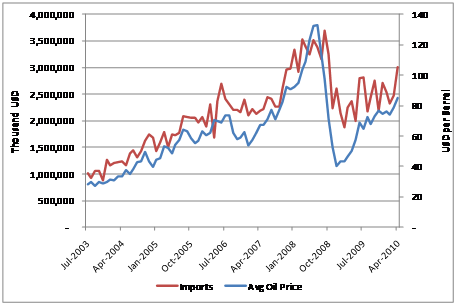
Based on this underlying relationship with the crude oil prices the imports have been estimated for the months of May and June 2010 as given in the table above.
Exports and Trade Balance
In general, exports receipts have been increasing overtime accounting on average for a 1.40% growth on a month on month basis and an average of 9.16% growth on a year on year basis for the period July 2003 to April 2010. This is depicted by the upward incline in the trend line in the graph below:
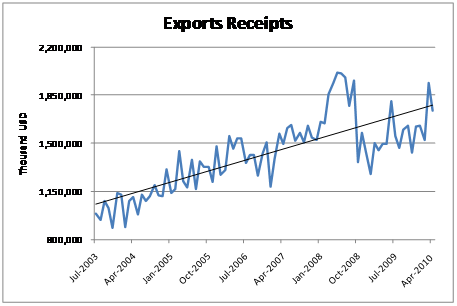
Based on this, we have estimated the export receipts for the months of May and June 2010. Using these forecasted figures together with the actual figures for the months of July 2009- April 2010 for imports and exports we have estimated the Trade Balance for the FY 2010 which works out to a deficit of US$ 10.435 billion.
| AMOUNTS IN THOUSAND USD | IMPORTS | EXPORTS | TRADE BALANCE |
| May-2010 | 1,744,923.87 | 2,449,485.74 | (704,562) |
| Jun-10 | 1,898,334.51 | 2,335,667.62 | (437,333) |
| FY2010 | 19,772,691 | 30,207,960 | (10,435,269) |
Remittances
As in the case with export receipts remittances have also been on the rise, in general since FY 97. Already for the period, Jul-March 2010 remittances stood at US$ 6.550 million which was almost 16% higher than remittances received for the same period in the last fiscal year. Over the period 1997 – 2009 remittances have witnessed a growth of on average 20% per year.
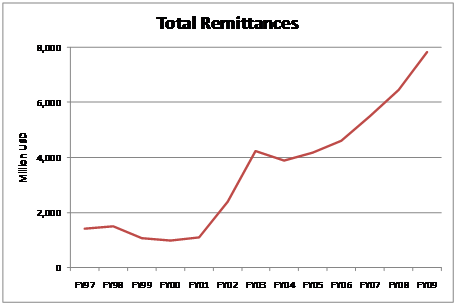
Therefore, it is assumed that this increasing trend will continue for FY 2010. The results of our forecasts under this baseline case are given below:
| REMITTANCES (MILLION USD) | FY2010 |
| Cash | 8,892.98 |
| Encashment & Profit of FEBC’s and FCBC’s | 1.35 |
| Total | 8,894.32 |
Current Account Balance
The current account balance comprises of 4 major elements: trade balance which we have already considered above, net trade in services, net income received from salaries, portfolio investment and direct investment, etc and net current unilateral transfers.
For net trade in services and net income received we anticipate that the growth in the payments received/ made for the remaining period in the fiscal year will correspond with that experienced during the same period last year. Worker’s remittances account for historically close to 60% (on average) of total current unilateral transfers. Forecasts for net current transfers are based on this relationship with worker’s remittances that we have already derived earlier. The results are presented below:
| CURRENT ACCOUNT BALANCE (MILLION USD) | FY 2010 |
| Trade Balance | -10,435.27 |
| Services (Net) | -1,943.73 |
| Income (Net) | -2,759.29 |
| Current Transfer (Net) | 15,967.45 |
| Current Account Balance = Increase (Decrease) in NFA | 829.16 |
The balance of the current account is by definition equal to the increase (current account surplus) or decrease (current account deficit) in the net foreign assets of the country. As can be seen above, the increase in net foreign assets has been forecasted as USD 829.16 million for the period July 2009-June 2010.
Net Foreign Assets
Net foreign assets (NFA) is one of the major components of Broad Money Aggregates or M2. M2 is denominated in PKR whereas the increase in net foreign assets during the FY 2010 derived from the current account balance is denominated in USD. The conversion is effected based on the current foreign exchange rate which is around USD 86.32. The cumulative figure is derived by adding the increase to the M2 figure as at end June 2009.
| NET FOREIGN ASSETS | ||
| FY 2009 (Million PKR) | 517,330.00 | |
| Increase in NFA (Million USD)-A | 829.16 | |
| FX rate (USD-PKR)-B | 86.32 | |
| Increase in NFA (Million PKR)-A*B | 71,570.43 | |
| FY 2010 (Million PKR) | 588,900.43 |
M2
Besides NFA above, other major components of M2 are the credit to the private sector, credit to public sector enterprises and net government borrowing. As can be seen in the graph below all of these factors have been growing over time:
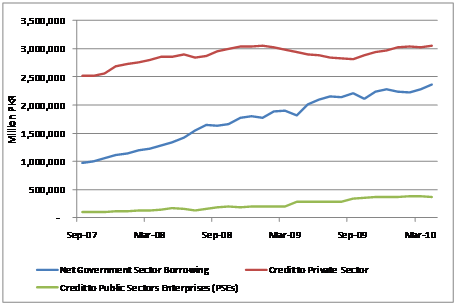
Assuming that this growth will be experienced in the remaining months of fiscal year 2010 we have projected these three components to end June 2010.
Historically, these components together with NFA account for 114% of M2 on average. Again assuming that this relationship will hold in the future Broad Money Aggregates for FY end 2010 has been forecasted. This forecasted figure is 13.09% higher than the figure at the end of FY 2009.
| M2 (MILLION PKR) | FY 2010 |
| Net Foreign assets-A | 588,900.43 |
| Net Government Sector Borrowing-B | 2,425,125.58 |
| Credit to the Private Sector-C | 3,086,013.61 |
| Credit to PSE-D | 381,230.54 |
| E=A+B+C+D | 6,481,270.16 |
| E as a %age of M2 | 114% |
| M2 | 5,703,567.15 |
| M2 growth (year on year) | 13.09% |
Inflation
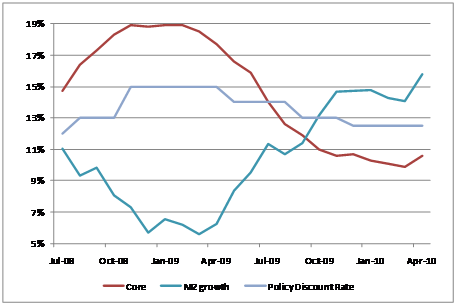
The graph above indicates a relationship between M2 growth and Core inflation. This relationship has been used to determine what Core inflation will be like in June 2010. Further the relationship between Core inflation has been used to determined CPI inflation and in turn the relationship between CPI and WPI and SPI respectively have been used to derive these inflation figures. The results for all these inflation metrics are given in the table below:
| INFLATION | JUN-10 |
| Core | 13.64% |
| CPI | 16.63% |
| WPI | 24.09% |
| SPI | 21.22% |
Monetary Policy
As we see in the graph there is a relationship between the core inflation rate and the policy discount rate. Generally, as inflation increases the monetary policy is tightened and the policy discount rate is increased. The opposite happens when inflation declines- the monetary policy is relaxed and the policy discount rate is cut. For the prior two cuts in the policy discount in August and November 2009, a minimum difference between the policy discount rate and the core inflation rate was maintained. Taking these factors into account the detailed results are presented in the table below:
| Forecasted Results | |
| Existing Policy Discount Rate | 12.5% |
| Core Inflation Rate | 13.64% |
| Minimum Difference after cut | 1.8% |
| Maximum Cut | 0.0% |
| Forecasted Policy Discount Rate | 12.5% |
Alternative Scenarios
As the results for the various factors above are based on assumptions it is also necessary to look at the best and worst results obtained to set outer bounds to our estimates. The best case scenario presents the most favorable results obtained for each of the various factors impacting the final monetary policy discount rate. In a similar manner, the worst case scenario presents the worst possible results obtained for each of the various factors from among the different analytic techniques used. The results are presented below:
Best Case Scenario
The best case results for the individual factors mentioned above are given below:
| Brent Crude Oil Spot Prices | USD per barrel |
| May average price | 72.17 |
| June average price | 64.86 |
Best case crude oil prices are lower for the months of May and June 2010. This represents the scenario where oil prices continue there downward slide due to various factors primary of which is the glut in world inventories.
The direct result of the decline in prices is a decrease in import payments for the months of May and June 2010. This together with a more favorable result for export receipts based on yearly averages of growth lead to a trade deficit that is 14% lower than the baseline balance of trade figure.
| Amounts in thousand USD | Imports | Exports | Trade Balance |
| Jul-Jun-2010 | 30,034,584.41 | 21,041,446.36 | -8,993,138.05 |
A more optimist outlook based on year on year growth figures, for remittances projects a much sharper increase in remittances for the year ended June 2010:
| Remittances (Million USD) | FY2010 |
| Cash | 9,623.37 |
| Encashment & Profit of FEBC’s and FCBC’s | 0.32 |
| Total | 9,623.68 |
Plugging the balance of trade and remittances figures derived above into the current account we project a current account surplus almost 4.5 times that of our baseline scenario.
| Current Account balance (million USD) | FY 2010 |
| Trade Balance | -8,993.14 |
| Services (Net) | -1,944 |
| Income (Net) | -2,759 |
| Current Transfer (Net) | 17,283.67 |
| Current Account Balance= Increase (Decrease) in NFA | 3,587.51 |
The surplus in the current account which is the increase in the net foreign assets for the fiscal year 2010 is converted in PKR by applying a foreign exchange rate that assumes that the Pakistan Rupee appreciates against the US dollar by end of FY 2010 as compared to the current exchange position.
| Net Foreign Assets | ||
| FY 2009 (Million PKR) | 517,330.00 | |
| Increase in NFA (Million USD) | 3,587.51 | |
| FX rate (USD-PKR) | 82.033 | |
| Increase in NFA (Million PKR) | 294,295.05 | |
| FY 2010 (Million PKR) | 811,625.05 |
Best case results for each of the 4 major components of M2 are chosen as follows:
For net government sector borrowing a favorable view would be a decline in government sector borrowing, whereas best estimates for private and public sector enterprise credit would be an increase in these values indicating a much needed growth in private and PSE investment that could eventually lead to economic growth. Based on these individual best case scenarios the M2 growth is expected to be 16.95% for FY 2010.
| M2 (Million PKR) | FY 2010 |
| Net Foreign assets-A | 811,625.05 |
| Net Government Sector Borrowing-B | 2402637.512 |
| Credit to the Private Sector-C | 3,091,763.60 |
| Credit to PSE-D | 396,171.67 |
| E=A+B+C+D | 6,702,197.83 |
| E as a %age of M2 | 114% |
| M2 | 5,897,985.18 |
| M2 growth (year on year) | 16.95% |
Using the relationships between M2 and inflation and inflation and the policy discount rate elaborated on earlier the best case results are presented below:
| Inflation | Jun-10 |
| Core | 9.64% |
| CPI | 12.63% |
| WPI | 20.09% |
| SPI | 17.22% |
| Existing Policy Discount Rate | 12.50% |
| Minimum Difference after cut | 1.80% |
| Maximum Cut | 1%-1.5% |
| Forecasted Policy Discount Rate | 11-11.5% |
Under the best case scenario we expect a cut in the monetary policy rate of between 100 to 150 bps.
Worst Case Scenario
The worst case results for the individual factors mentioned above are given below:
| Brent Crude Oil Spot Prices | USD per barrel |
| May average price | 76.08 |
| June average price | 74.96 |
Worst case crude oil prices indicate that the prices of crude oil will rise once again in May and June 2010. This will raise the amount of import payments for these months. This together with a less favorable result for export receipts, based on growth experienced in the remaining months of FY 2009, lead to a trade deficit that is more than 13.5% higher than the baseline balance of trade figure.
| Amounts in thousand USD | Imports | Exports | Trade Balance |
| Jul-Jun-2010 | 30,392,080.32 | 18,541,811.26 | – 11,850,269.06 |
Using this balance of trade figure together with worst case lower estimates for the current transfers, net services and net income as compared to the baseline and best case scenarios results in a significant current account deficit and hence a decline in the NFA of USD 9.1 billion.
| Current Account balance (million USD) | FY 2010 |
| Trade Balance | -11,850.27 |
| Services (Net) | – 4,723.60 |
| Income (Net) | -4,803.80 |
| Current Transfer (Net) | 12,240.42 |
| Current Account Balance= Increase (Decrease) in NFA | -9,137.25 |
Translating this decrease into PKR we use a foreign exchange rate that has further depreciated against the USD. This leads to a negative NFA figure at the end of FY 2010.
| Net Foreign Assets | ||
| FY 2009 (Million PKR) | 517,330.00 | |
| Increase in NFA (Million USD) | -9,137.25 | |
| FX rate (USD-PKR) | 90.60 | |
| Increase in NFA (Million PKR) | -827,841.32 | |
| FY 2010 (Million PKR) | -310,511.32 |
Worst case results for net government sector borrowing indicates an increase in the amount whereas unfavorable estimates for private and public sector enterprise credit would be a decline in their values indicating that the banks are still not confident in lending to these enterprises. Based on these individual worst case scenarios the M2 is expected to decline by 1% from fiscal year end 2009.
| M2 (Million PKR) | FY 2010 |
| Net Foreign assets-A | -310,511.32 |
| Net Government Sector Borrowing-B | 2,540,480.11 |
| Credit to the Private Sector-C | 3,086,013.61 |
| Credit to PSE-D | 358,136.01 |
| E=A+B+C+D | 5,674,118.41 |
| E as a %age of M2 | 114% |
| M2 | 4,993,267.45 |
| M2 growth (year on year) | -0.99% |
Using the relationships between M2 and inflation and inflation and the policy discount rate elaborated on earlier the worst case results are presented below:
| Inflation | Jun-10 |
| Core | 28.25% |
| CPI | 31.25% |
| WPI | 38.70% |
| SPI | 35.83% |
| Existing Policy Discount Rate | 12.50% |
| Minimum Difference after cut | 1.80% |
| Maximum Cut | 0% |
| Forecasted Policy Discount Rate | 12.50% |
Assuming that the SBP is not considering the option of further tightening monetary policy the worst case result also indicates that there will be no cut in the upcoming monetary policy and the policy discount rate will remain unchanged at 12.5%
Relationship between the policy discount rate and the 3-month T-Bill Rate
Generally, it is expected that as the market begins to anticipate a cut in the policy rate the spread between it and the 3-month T-Bill yield will widen as the yield required on T-Bills begin to fall. We can see evidence of this widening gap in periods before the previous rate cuts.
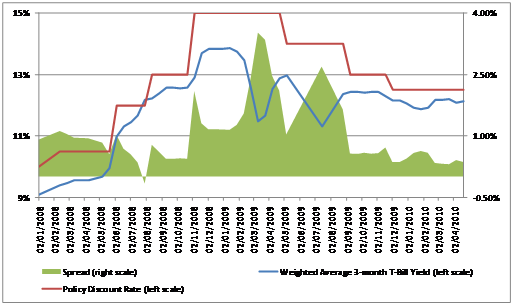
However, the current trend does not indicate a widening of this spread at the end of April of 2010. In fact, the opposite seems to be true, that is, there appears to be a narrowing in the spreads. Based on this we anticipate that the baseline scenario presented above is the most likely scenario. Provided there is no further tightening of the monetary policy the policy discount rate is likely to remain unchanged for the May 2010 monetary policy statement at 12.5%. However, if the inflation continued to increase, there is a possibility that the monetary policy could be further tightened and we could possibly see an increase in the policy discount rate of between 1%-1.5% to 13.5%-14%.
An ientllgient point of view, well expressed! Thanks!