Earlier we had defined the input cells for the Heath-Jarrow-Merton (HJM) multifactor no-arbitrage model in EXCEL. In this post we will see how the calculation cells are built up. These include cells for calculating the Brownian shocks, Drifts and Spot and Forward rates.
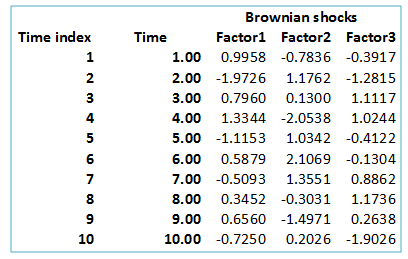
Brownian Shocks
Brownian shocks to be applied to the volatility factors in the HJM model, dzi, are obtained as follows. Using Excel’s random function, RAND () we scale the resulting number to the normal distribution by applying the inverse of the standard normal distribution function NORMSINV(). Combined this can be determined in excel using the following formula: NORMSINV(RAND()). These values are derived for each Factor across all time intervals. Whenever the user hits the F9 function button on their key board new results for this formula will be simulated:
Drifts
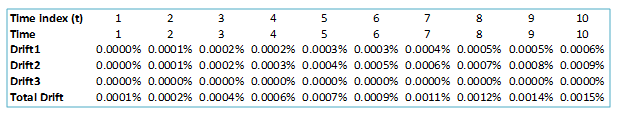
Driftkt=0.5*dt*( ?x =1 to t Factorkx)2 – (?i=0 to t-1Driftki), for k = 1, 2, 3 and where Driftk0=0 and.
Total Driftt= Drift1t +Drift2t +Drift3t
Spot and Forward Rates Matrix
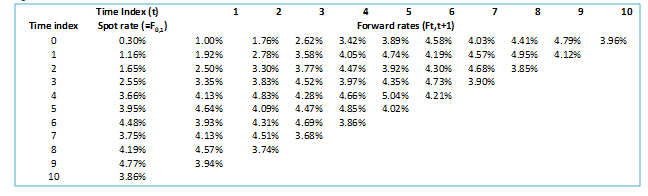
The one-period spot / short rate (=F0,1) and forward rates (Ft,t+1) are derived using the initial yield curve, Brownian shocks, drifts and scaled volatility factors (Factors 1, 2 and 3) and the following formula:
At time index 0 (as given by the first column in the diagram above) the spot and forward rates are derived using the following formula:
Spot Rate0= Initial Yield1 = 0.30%
Forward Rate0 (t,t+1)=Time Indext+1*Initial Yieldt+1– Time Indext*Initial Yieldt , for t = 1 to 10
Where t is the Time Index (as given by the first row in the diagram above)
For example, Forward Rate0 (1,2)=Time Index2*Initial Yield2– Time Index1*Initial Yield1=2*0.65%- 1*0.30% = 1%.
(Note this is equivalent to the continuous formula for forward rates ef(T2-T1)=er2T2/ er1T1).
At time index 1 and later (as given by the first column in the diagram above) the one-period spot and forward rates are derived using the following formula:
Spot Rate1 = Forward Rate0 (1,2)+Total Drift1*dt+?dt*(Factor11*dz11+ Factor21* dz21+ Factor31* dz31)
Spot Rate2 = Forward Rate1 (1,2)+Total Drift1*dt+?dt*(Factor11*dz12+ Factor21* dz22+ Factor31* dz32)
Spot Rate3 = Forward Rate2 (1,2)+Total Drift1*dt+?dt*(Factor11*dz13+ Factor21* dz23+ Factor31* dz33)
…and so on
Forward Rate1(t,t+1)= Forward Rate0 (t+1,t+2)+Total Driftt+1*dt+?dt*(Factor1t+1*dz11+ Factor2t+1* dz21+ Factor3t+1* dz31)
Forward Rate2(t,t+1)= Forward Rate1 (t+1,t+2)+Total Driftt+1*dt+?dt*(Factor1t+1*dz12+ Factor2t+1* dz22+ Factor3t+1* dz32)
…and so on
Where t is the Time Index (as given by the first row in the diagram above)
For time index 2 to 10 (as given by the first column in the diagram above) the same procedure will be used.
In this post we constructed the calculation cells for the HJM model, in particular cells for Brownian Shock, Drifts including Total Drift and the spot and forward rate matrix. In the next post we will define the output cells for the model and see what the results to the calculation are.
Comments are closed.