Earlier we had considered an ALM Liquidity risk measure, namely the Cost to Close Liquidity Gap methodology. In this post, we will look at an example of the report that demonstrates this liquidity risk measurement technique.
Cost to Close Gap Example
We illustrate the measure below for ‘Bank A’ at a high level. This example assumes that individual asset and liability cash flows have already been slotted into the relevant time buckets of the report and have been summed:
Time Buckets (in years)
| (USD in millions) | 0.08 | 0.25 | 0.50 | 0.75 | 1 | 3 | 5 |
| Assets | 1 | 3 | 4 | 9 | 10 | 8 | 7 |
| Liabilities | 2 | 4 | 0 | 5 | 12 | 3 | 2 |
| Liquidity Gap | –1 | -1 | 4 | 4 | -2 | 5 | 5 |
Gross Gap
We now begin by assessing a Gross Cost to Close first by taking into account only positive gaps and then by taking into account both negative and positive gaps. For positive gaps, the gap will be filled by borrowing from the market at the borrowing rate, while negative gaps will be filled by lending the excess funds at the lending rate. This is illustrated for Bank A below:
Time Buckets (in years)
| (USD in millions) | 0.08 | 0.25 | 0.50 | 0.75 | 1 | 3 | 5 |
| Liquidity Gap | -1 | -1 | 4 | 4 | -2 | 5 | 5 |
| Lending Rate | 15% | 14% | 0.50 | 0.75 | 1 | 3 | 5 |
| Borrowing Rate | 12% | 11% | 11% | 11% | 13% | 14% | 15% |
| Gross Cost to Close (only positive gaps) | – | – | 0.22 | 0.33 | – | 2.10 | 3.75 |
| Cumulative Gross Cost to Close (only positive gaps) | – | – | 0.22 | 0.55 | 0.55 | 2.65 | 6.40 |
| Gross Cost to Close (all gaps) | (0.01) | (0.04) | 0.22 | 0.33 | (0.30) | 2.10 | 3.75 |
| Cumulative Gross Cost to Close (all gaps) | (0.01) | (0.05) | 0.17 | 0.50 | 0.20 | 2.30 | 6.05 |
Positive gaps only
For each time bucket of the report, the Gross figure that uses only positive gaps is calculated as the Liquidity Gap (if positive) times the Borrowing Rate applicable to that time bucket times the Time Bucket Tenor (upper bound expressed in years). For example, for the time bucket with upper bound 6 months (o.5 years):
Gross Cost-to-Close (only positive gaps) = 4*11%*0.50 = USD 0.22 million.
Cumulative Gross Cost-to-Close (only positive gaps) is the cumulative sum of Gross amounts for each time bucket up to and including the relevant bucket. For example, the cumulative value for time bucket 5 years in the report is the sum of all the gross values across positive gaps only in the time buckets up to 5 years, i.e. USD 6.4 million.
All gaps
The Gross Cost-to-Close (all gaps) is calculated as:
the Liquidity Gap
times
either the Borrowing Rate if the Gap is positive or the Lending Rate if the Gap is negative
times
the Time Bucket Tenor (upper bound expressed in years).
For example, for time bucket 9-12 months (1 year) the value equals = -2*15%*1 = USD -0.30 million.
The Cumulative Gross Cost-to-Close (all gaps) is the cumulative sum of Gross amounts across all gaps for each time bucket up to the relevant bucket. For example, the cumulative value for time bucket 5 years is the sum of all the values across all gaps for time buckets up to 5 years, i.e. USD 6.05 million.
Annualized Gap
We will also calculate an annualized value by scaling the amounts for those buckets which are beyond 1 year to 1 year. The amounts for periods less than one year will be taken as is. This is illustrated below:
Time Buckets (in years)
| (USD in millions) | 0.08 | 0.25 | 0.50 | 0.75 | 1 | 3 | 5 |
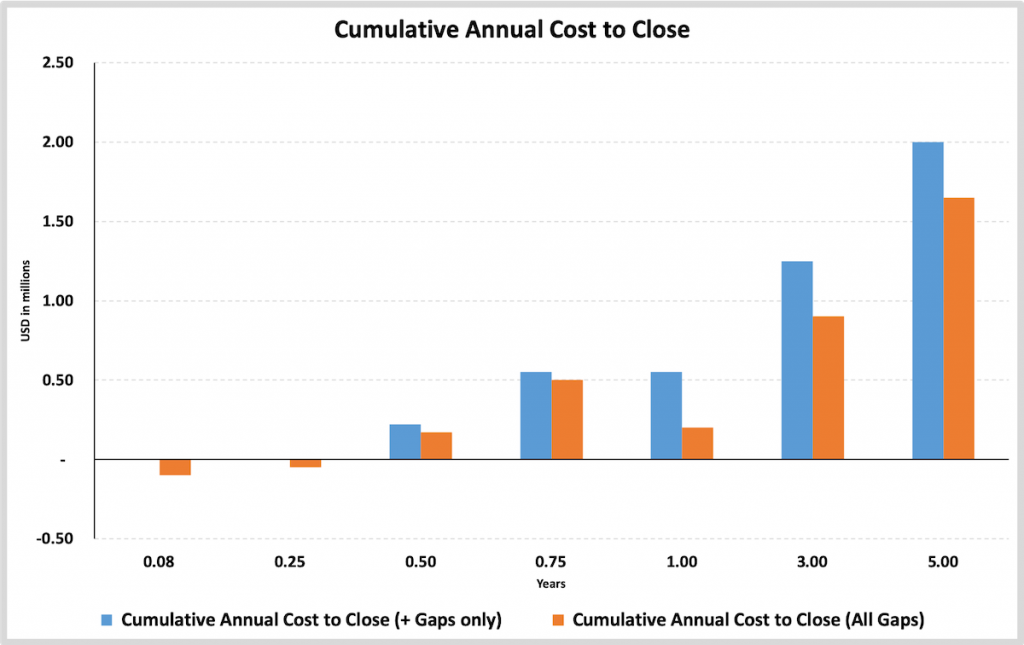
| Annual Cost to Close (only positive gaps) | – | – | 0.22 | 0.33 | – | 0.70 | 0.75 |
| Cumulative Annual Cost to Close (only positive gaps) | – | – | 0.22 | 0.55 | 0.55 | 1.25 | 2.00 |
| Annual Cost to Close (all gaps) | (0.01) | (0.04) | 0.22 | 0.33 | (0.30) | 0.70 | 0.75 |
| Cumulative Gross Cost to Close (all gaps) | (0.01) | (0.05) | 0.17 | 0.50 | 0.20 | 0.90 | 1.65 |
Positive gaps only
For each time bucket in the report, the Annual Cost to Close (only positive gaps) is calculated as the Liquidity Gap (if positive) times the Borrowing Rate applicable to that time bucket times the Time Bucket Tenor (upper bound expressed in years). The tenor is subject to a maximum of 1 year. For example, for the time bucket with upper bound 3 years:
Annual Cost-to-Close (only positive gaps) = 5*14%*1 = USD 0.70 million.
Cumulative Annual Cost-to-Close (only positive gaps) is the cumulative sum of annual amounts across only positive gaps for each time bucket up to the relevant bucket. For example, the cumulative value for time bucket 5 years is the sum of all the annual amount across only positive gaps for time buckets up to 5 years, i.e. USD 2 million.
All gaps
The Annual Cost-to-Close (all gaps) is calculated as the Liquidity Gap times either the Borrowing Rate if the Gap is positive or the Lending Rate if the Gap is negative times the Time Bucket Tenor (upper bound expressed in years). The tenor is subject to a maximum of 1 year. For example the annual amount for the time bucket 3-5 years (5 years) = 5*15%*1 = USD 0.75 million.
The Cumulative Annual Cost-to-Close (all gaps) is the cumulative sum of annual amount across all gaps for each time bucket up to the relevant bucket. For example, the cumulative value for time bucket 5 years is the sum of all the annual amounts across all gaps for time buckets up to 5 years, i.e. USD 1.65 million.
Net Cost to Close
When there is a positive gap, it means that the bank has invested or lent money. This cash outflow will earn an interest income. We are therefore also interested in what the net cost to close will be across all positive gaps after taking into account the average return that will be earned on assets. This is illustrated below for Bank A.
The weighted average return on assets the Bank A will earn is the sum product of the positive gaps times the lending rates applicable to the relevant time buckets divided by the total of all the positive gaps, i.e.
Average Return on Assets (%) = (4*14%+4*14.5%+5*18%+5*18%)/(4+4+5+5) = (0.56+0.58+0.90+0.90)/18 = 2.94/18 = 16.33%.
Average Return on Assets = 16.33% * 18 = USD 2.94 million
Net Cost-to-Close = Cumulative Gross Cost to Close (only positive gaps) – Average Return on Assets = 6.4 -2.94 = USD 3.46 million.
We have presented a simple example of the Cost-to-Close Liquidity Gap methodology above which may be used as a liquidity risk measure as part of a bank’s ALM and Liquidity Management process.