Jensen’s Alpha is the risk-adjusted performance metric that measures a portfolio manager’s returns against those of a benchmark. For asset allocation, the portfolio consists of the instrument being analyzed (e.g. equity stock). The benchmark is a broad market index (e.g. S&P 500). In other words, we are assessing the instrument’s returns against those of a broad market index. We are measuring the instrument’s performance relative to the respective broad market index. Alpha represents the return that is the unique or excess return of that instrument over the market.
If the alpha is not statistically different from zero there is no unique return over the return the benchmark earns. This means that the instrument’s performance is in line with that of the market. A statistically positive alpha means that the instrument has performed better than the market index. A negative value for alpha means that the instrument underperformed the market index.
Regression analysis to determine Jensen’s Alpha
We use regression analysis to estimate alpha. In particular, we employ a least squares estimation approach. Minimize the sum of squared differences between the instrument’s actual returns and those we estimate using the following equation:
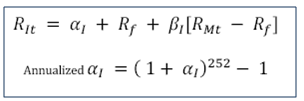
Where
RIt = Daily rate of return of instrument, I, at time t
Rf = Daily risk free rate of return. The risk free rate of return is usually specified in annualized terms. In order to convert the annualized figure to a daily number, we will employ the following formula. We assume 252 trading days in a year:
Daily risk free rate of return = (1+ annual risk free rate of return)1/252-1
RMt = Daily rate of return of the market index, M, at time t
βI = Beta of the instrument with respect to the market index
αI = Daily unique rate of return of instrument I.
Annualized αI = Annualized unique rate of return of instrument I over the market rate of return, i.e. Jensen’s Alpha.
Let us now review the step-by-step calculation methodology for Jensen’s Alpha in EXCEL.
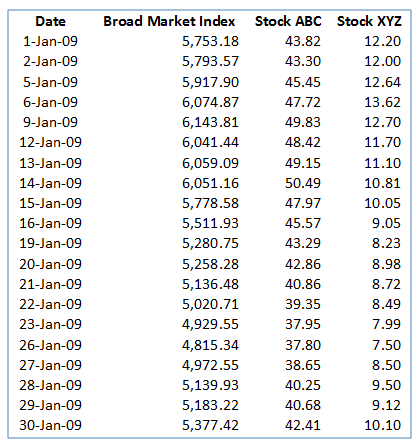
1. Obtain data
First, obtain the time series price data for the instruments and the broad market index for the analysis period.
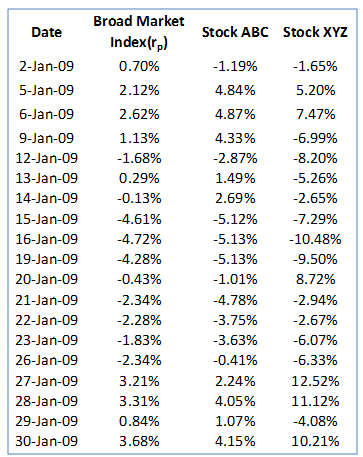
2. Calculate returns
Next, calculate the daily return time series from the price data. Calculate the daily returns by taking the natural logarithm of the ratio of successive (consecutive) prices:

The figure below presents the resulting actual return series for the stocks and the market index:
3. Calculate estimated returns with dummy alpha values
The betas for stock ABC and XYZ with respect to the broad market index have already been calculated as 1.20 and 2.16 respectively. The method for calculating beta is discussed in our post:
Market Risk Metrics – Beta with respect to market risk indices
The annual risk free rate is 12%. The daily risk free rate as discussed above works out to:
Daily risk free rate = (1+12%)1/252-1=0.045%.
Using the formula for estimated returns given above and assuming initial dummy values for daily alpha returns for the stocks of 0.5% each we arrive at the estimated return series as follows:
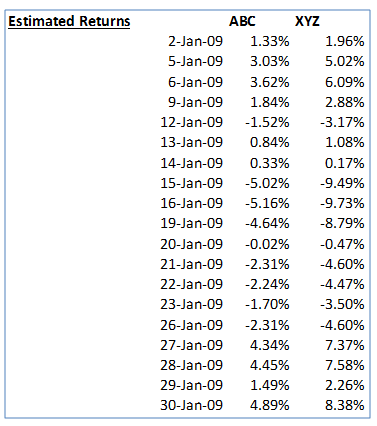
Note that the estimated returns given above are not the final estimated values. They are dependent on the initial dummy values input-ed for the daily alpha. Note also that we assume that the daily alpha is constant over the dataset. It does not vary with time.
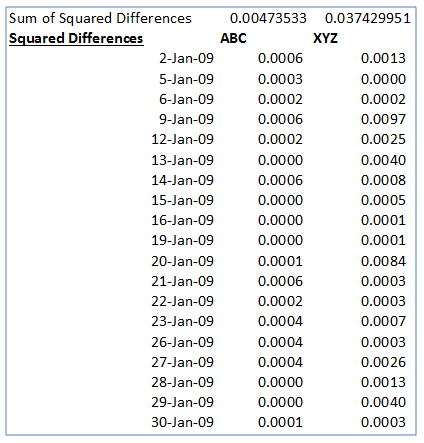
4. Calculate squared differences
Next, at each data point, we will calculate the squared differences between the actual returns and the estimated returns, i.e. Square Difference = (Actual return –Estimated return)2. We then calculate the sum of the squared differences across all data points. The figure below illustrates the results of these two steps for our example:
5. Setup EXCEL SOLVER
Set up EXCEL’s Solver function to minimize the sums of squared differences by changing the daily alphas values.
For each stock we will follow the process mentioned below:
- Step 1: Data Tab>Solver
- Step 2: “Set Target Cell” to the “Sum of squared difference” cell for the stock
- Step 3: Equal to: Min or Value =0
- Step 4: By Changing Cells: “Daily est. alpha” cell for the stock
- Step 5: Click on the Solve button to solve.
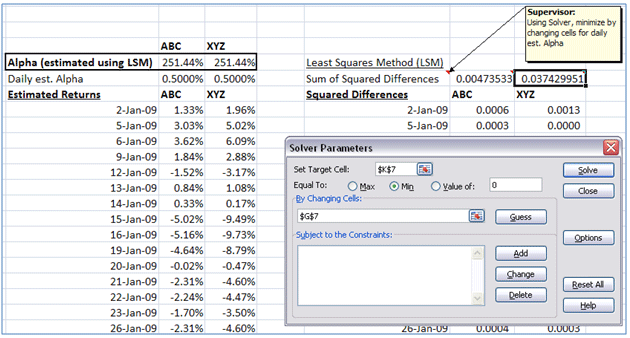
Use the procedure above for each instrument on the portfolio.
6. Run SOLVER and determine annualized alphas
The resulting daily and annualized alphas after Solver converged to a solution are as follows:
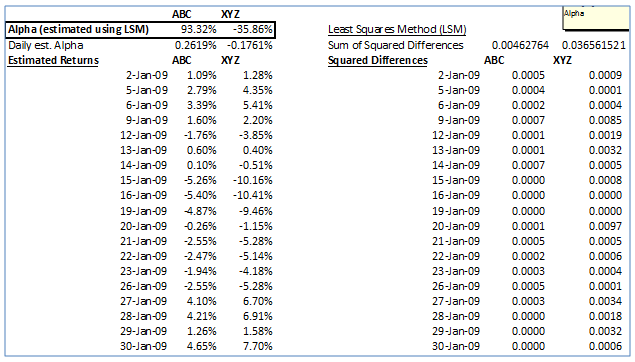
The annualized estimated alphas for stocks ABC and XYZ work out to 93.32% and -35.86% respectively. We can see that stock ABC has over performed the market whereas stock XYZ has underperformed the market.
7. Significance test the alphas
It is important to test the alphas for statistical significance. One way of doing this is to calculate the information ratio or t-statistic. This is the ratio of the estimated annualized alpha to the standard error (annualized) of the regression. If the absolute value of this ratio exceeds 1.96 (which is critical value at the 5% significance level) then we can say that the alpha is different from zero and that it is statistically significant.
Calculate the annualized standard error, i.e. the denominator of the above mentioned ratio as follows:
First, calculate the difference between the actual and estimated returns:
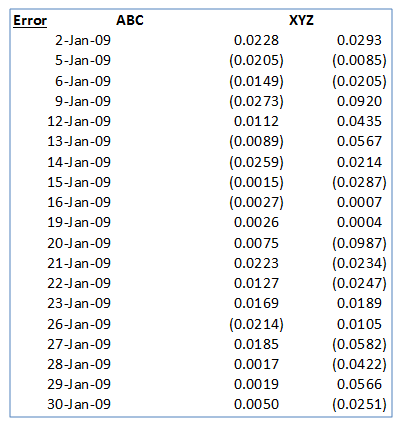
Next, for each stock, calculate the daily volatility of these differences, i.e. the standard deviation of the error terms. This can be done in EXCEL using the STDEV() function applied to the array of differences. For stocks ABC and XYZ this works out to 1.60% and 4.51% respectively.
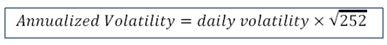
Annualized volatility, i.e. the annualized standard error term is calculated using the following formula:
They work out to 25.45% and 71.54% for stocks ABC and XYZ respectively.
Now for each stock, we calculate the statistic for the significance test. For stock ABC, calculate this as follows:
Test Statistic = absolute value of {Annualized Alpha/ Annualized standard error} = 93.32%/25.45%=3.67.
In a similar manner, the test statistic for stock XYZ works out to 0.50.
As mentioned earlier if the value of the test statistic exceeds 1.96, i.e. the critical value for the t-test at the 5% significance level, then we can say that the alpha is different from zero and that it is statistically significant. For the dataset and using this test, we see that only the Jensen’s alpha for stock ABC is statistically significant. The test statistic for this instrument, 3.67, exceeds the critical value for the test, 1.96.