Presenting the case to the client

As part of our risk management training course in June we did a fair bit of work building and presenting the case for Jet Fuel Hedging for an airline. This post takes up the mantle where we stopped our hedge discussion in June and extends the analysis for a hedge effectiveness presentation to the board of an airline. The work done for this post is based on a treasury products workshop recently run for a banking customer in the Middle East. The analysis and presentation is based on assumptions and publicly available information and has received no direct input or sanction from Emirates airline or our banking customers in the Middle East.
In our previous post we had examined the relationship between fuel oil and crude oil & the correlation across different oil blends. We then built a simple model that we used to simulate the P&L of the airline in question and calculated probability of shortfall.
The board has now come back to us with a few questions and the objective of this session is to answer those questions with the data available.
Jet Fuel (Aviation) Hedge Case Study – Questions from the Board
a) The first question deals with expected future volatility as well as current volatility levels. The Board understands that volatility cuts both ways. It makes sense to hedge when we expect volatility to shoot up but it the impact of current volatility also has a direct relationship on the cost of the hedging program, especially if we use products with built in optionality. The board would like to know how bad can volatility get?
b) The second question deals with the impact of the hedge on the distribution of P&L. It is not sufficient to look at minimum and maximum values, the Board will actually like to see how the distribution of profits shifts and moves for hedged as well as un-hedged options.
c) The third question deals with the impact of volatility on these distributions.
d) The fourth question deals with the true cost of hedging when prices move against us as an airline (oil priced drop rather than rise).
e) The fifth question deals with the actual recommendation on hedge ratio. Should the airline hedge 25% – 50% – 75% or all of its Jet fuel exposure? How does the hedge ratio impact the distribution of profits?
Jet Fuel (Aviation) Hedge Case Study – What do the numbers look like for Emirates Airline?
The airline used for the purpose of this case is Emirates Airline.
The first required step is to estimate fuel consumption. Take a quick look at the last public financial statement released by Emirates. Emirates consumes between 5.6 to 6.2 million metric tonnes of aviation fuel every year. We will use this number for our calculations.
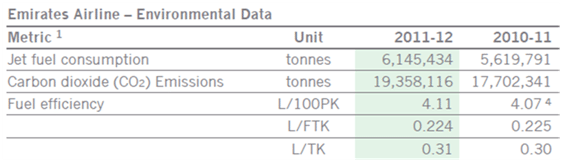
Figure 1 Jet Fuel (Aviation) Hedge Case Study – Emirates Annual Fuel Consumption
The impact of aviation fuel price volatility in 2011-2012 is apparent. Emirates profitability has declined by 70% when compared to the year before.
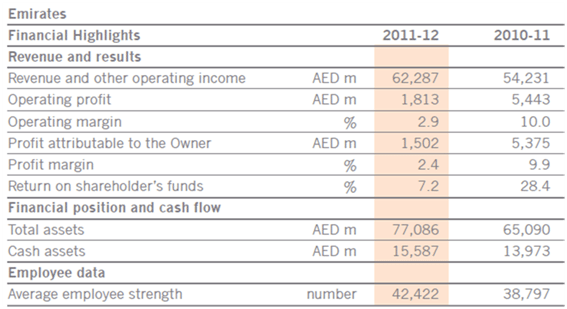
Figure 2 Jet Fuel (Aviation) Case Study – Emirates Financial Performance 2011-2012
What does fuel volatility look like using the last five years of data. We do a quick trailing volatility plot and then run a histogram in Excel on the same data to get some indication of the range of price volatility. The range for daily crude oil volatility is between 0.9% – 7.5%. Even though this is not a perfect proxy for aviation fuel the range does give us some indication of how much prices can jump in a 21 day period.
However there is one big implementation challenge. Even if daily volatility hits 7.5% on an empirical basis, implied volatility will never rise this high.
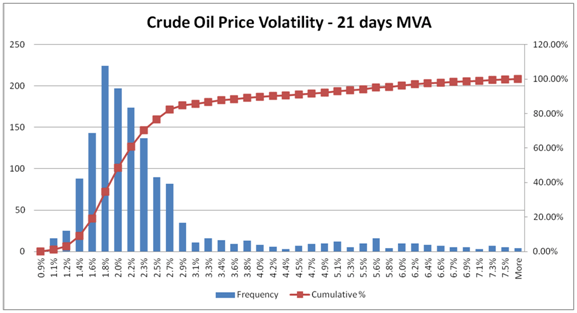
Figure 3 Jet Fuel Aviation Hedge Case Study – Crude oil price volatility distribution
We plug the numbers in our model. Emirates generates revenues of 62 billion AED growing at a rate of 8 – 9 billion AED a year. Projected forecast for the next 12 months is 72 billion AED. The simplistic Monte Carlo simulation model below looks at a two month revenue forecast which ties in with the average fuel purchase period (assumption). To see full year results simply multiply the numbers below by 6.
The model also takes in assumptions that relate changes in oil prices to changes in passenger mile demand and actual consumption. It models expenses and growth based on expected growth which is in turn linked to changes in oil prices. Higher oil prices lead to higher ticket prices and negative growth in demand; lower oil prices lead to lower ticket prices and positive growth in demand.
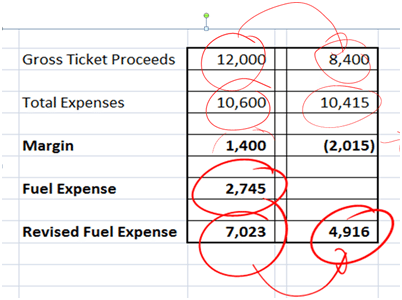
Figure 4 Jet Fuel (Aviation) Case Study – Simulation Model for Proftiability
The simulation run from the model is then stored in multiple data tables and the results are used to answer questions raised earlier by the board. For example the table below actually shows the range of Margin values for Hedge ratios ranging between 70% to 0%. It also shows the realized Gain or (Loss) on account of the hedge when prices move for or against us (rise or decline) in the last column.
The assumption is that the product used is Fuel Oil Future contracts traded on the NYMEX exchange. No options or structures are involved. Contracts are purchased once every two months to hedge the anticipated fuel consumption for the next 2 month period with a time lag.
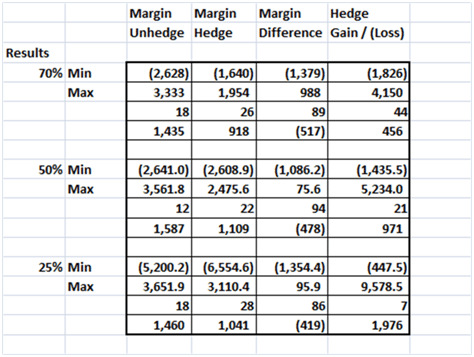
Figure 5 Jet Fuel Aviation Hedge Case Study – Simulation Results
While maximum and minimum ranges are useful what the board really wants to see are income distributions linked to hedge ratio choices.
Four P&L Distributions from the simulation engine above are presented below. Combined with the table presented in Figure 5 above we now have sufficient information to answer the Board’s questions. The hedge vaporizes the center (as expected) and tempers the extreme ends. It also has an impact on probability of shortfall as well as the expected loss when shortfall occurs.
The P&L distribution graphs cover the following scenarios as per the boards guidelines.
- Un Hedged – High Volatility world
- Hedged – High Volatility world – 30%
- Un Hedged – Low volatility world
- Hedged – Low volatility world – 70%
The high volatility world assumes a 40%-45% annualized volatility in oil prices. The low volatility world assumes a 15% – 20% annualized volatility in oil prices. Two different hedge ratios are tried at 30% and 70% to assess the impact of changing hedge ratios.
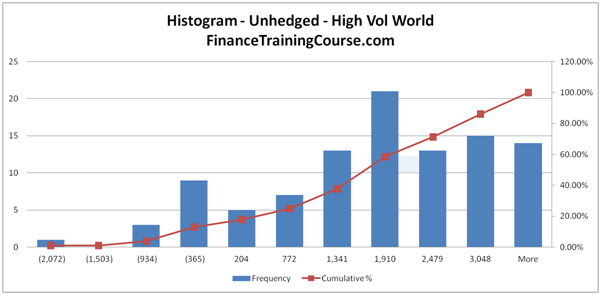
Figure 6 Jet Fuel Aviation Hedge – High vol – Unhedged strategy distribution of P&L
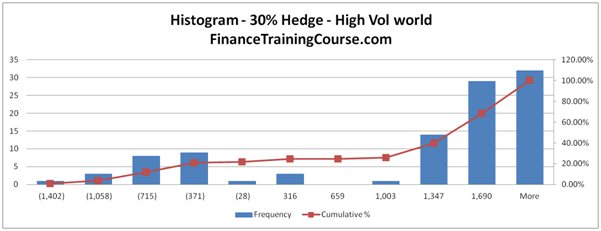
Figure 7 Jet Fuel Aviation Hedge – High vol – Hedged strategy distribution of P&L
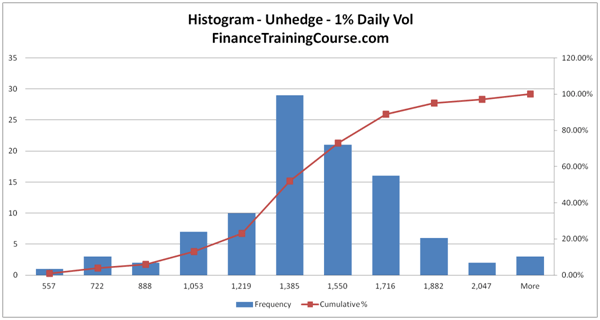
Figure 8 Jet Fuel Aviation Hedge – Low vol – Unhedged strategy distribution of P&L
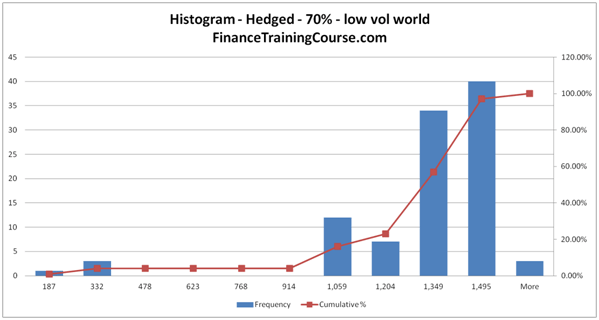
Figure 9 Jet Fuel Aviation Hedge – Low vol – Hedged strategy distribution of P&L
Jet Fuel Hedging – Additional reference, sources & downloadable case studies
Emirates-Financials-Disclosures
US Airways – Fuel Hedge Case Study
Comments are closed.