Excel Data Analysis
Yesterday I ran a short twenty minute session for 60 civil activists participating in the city’s first civic hackathon. The topic was data analysis in Excel. Here are my notes from the session on data analysis excel.
As a data specialist there are few common themes that I keep running across whenever I open up Excel to do real work.
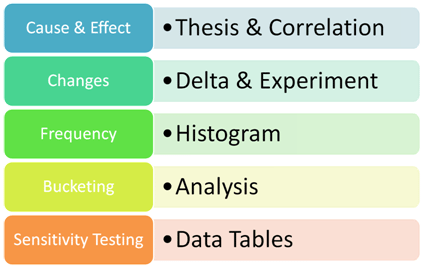
- Understanding cause and effect.
- Working with Deltas (changes) rather than absolutes .
- The Frequency, probability, histogram, distribution question.
- Bucketing for results.
- Data Tables & Sensitivity Testing.

What comes first? Thesis formulation or data?
From a design point of view it is always best to determine where you want to go before you start. In simple terms this means that you should form a thesis and then collect data to validate, verify or model your analysis.
Starting off with data and then looking for thesis generally results in trouble because:
- You can make data fit any thesis you want, or would like to see.
- Without a model, you may collect a dataset which is irrelevant and incomplete.
- A baseline model allows you to extrapolate relationships and ask meaningful questions.
- Meaningful questions lead to better analysis, results and presentation.
The only exception to this rule is a PhD thesis where meaningful questions without the right data set lead to infinite circles and years of academic servitude as a research analyst.
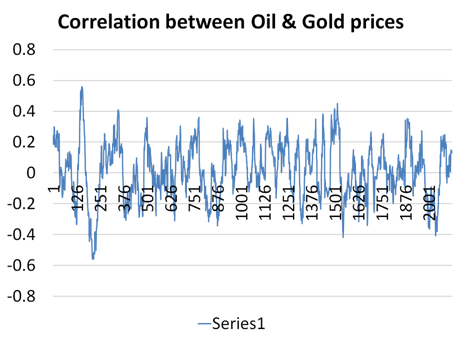
Once you have a model or suspicions of a relationship, go forth and use the correlation function (Excel – Correl) to confirm the suspicion. Once again if you started off with a defensible model, you are at an advantage because sometimes relationships are only coincidental without any real relevance or dependency.
When examining correlations looking at trailing correlations to see if the relationship is stable or cyclical. The graph below shows the cyclical nature of 30 day trailing correlation between oil and gold prices. Check out the Correlations basics course for a more detailed review of correlation topics.

Sometimes rather than looking at absolute numbers it is useful to examine relative changes. So rather than looking at the relationship between Oil and Gold absolute prices, take a look at relative returns. The two graphs below show both cases. While both have their uses, which one would you prefer?
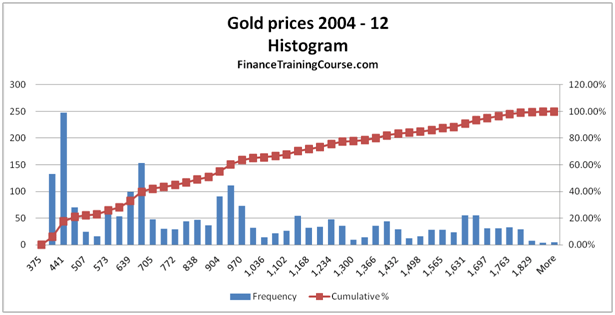
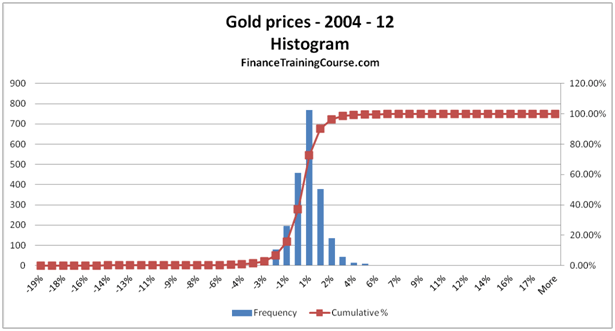

The last diagram above uses the Excel histogram tool. See Building Histograms in Excel tutorial for a step by step guide to building histograms. If you have 10,000 rows of data, a histogram does a great job of summarizing that data for you in a presentable format. It also answers the frequency, range, minimum, maximum questions at a glance and also gives you a clear indication of the underlying distribution.

While correlation and Histogram work well if you are analyzing a single dimension if you have multiple points of focus, nothing works better in summarizing data than Pivot Tables in Excel. See Using Pivot Tables in Excel to build maturity profiles for a detailed real life case study of how pivot tables are used to dissect a bank’s balance sheet.

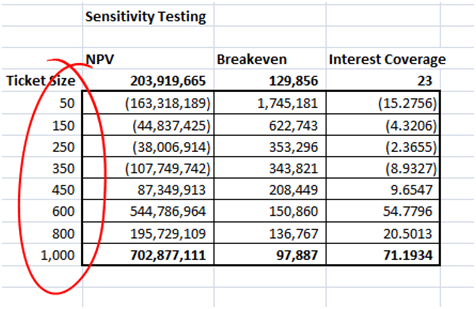
A data table allows you to calculate and store the results of sensitivity testing your model. For example using our retail store model we need to test the impact of average ticket size on both breakeven analysis as well as interest coverage ratio. Rather than manually inputting the values and storing them you can use an Excel Data Table to do the same analysis in a few seconds. See Data Analysis using Data Tables in Excel for a more detailed treatment of using Data Tables in Excel.
A quick summary of data analysis lessons:
- Form a thesis then go look for data.
- Run correlations on absolutes as well as on relative changes. Plot trailing correlations to test stability or cycles.
- Histograms summarize data and give you a view on the underlying distributions. Distributes can help validate models as well as identify solutions to a problem.
- Use pivot tables (cross tabs) if you have multiple dimensions of analysis (country, source, age, ticket size, purchase category, etc) to summarize and present tables.
- Use data tables to store extrapolated results.
Also see Building better charts in Excel.
Comments are closed.