NII, Earnings, Gaps, Asset & Liability Sensitivity
In our previous post, we encountered the curious case of interest rates rising across the board yet witnessing a decline in net interest income (NII) using our NII reporting template. In this post, we review the drivers that lead to such a scenario. We also re-examine the concept of asset liability mismatch, asset and liability sensitivity, asset liability allocation strategy, its interaction with shifts in interest rates and the combined impact on net interest margin (NIM).
We use the same stylized bank balance sheet with three maturity buckets (3, 6 and 12 months). All figures presented in the stylized example are in millions. There is a single interest rate for all assets and a single rate for all liabilities.
Liability Sensitivity, Positive & Negative Gap
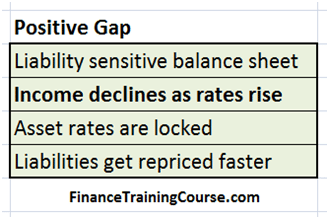
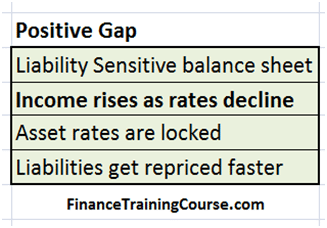
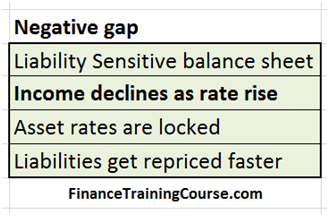
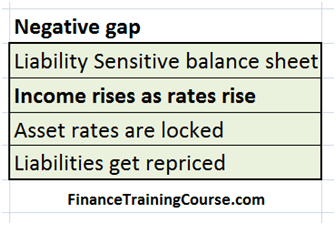
Liability sensitivity refers to a balance sheet structure where there is an asset liability mismatch and liabilities re-price or reset faster than assets. This means that interest rates on assets are locked down for longer periods of time when compared to liabilities.
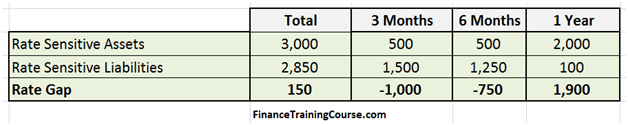
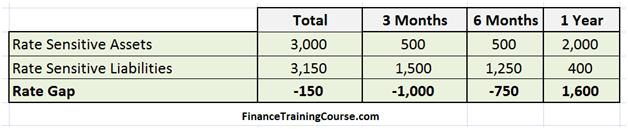
The balance sheet presented above is a liability sensitive balance sheet. Can you see why? 2.750 billion of the 2.850 in liabilities resets faster than the 2 billion in assets placed in the 1 year maturity bucket.
Under what projected interest rate conditions would you want your balance sheet to be liability sensitive?
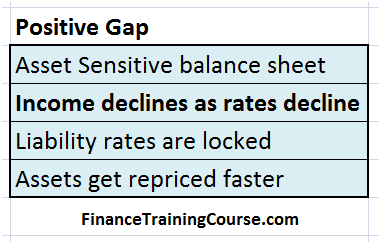
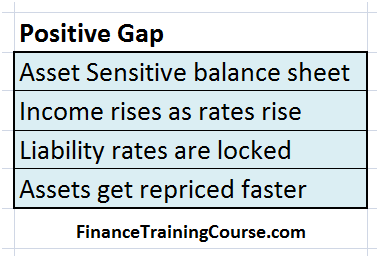
Note that the rate gap figure under the total in column one is positive. A positive rate gap is called just that. A positive gap indicates that there are more assets than liabilities in a given bucket. By that definition the total cumulative gap in the first column is positive, the next two buckets show a negative gap and the final bucket is again positive.
Hold on to the concept of positive and negative gaps. We are going to come back to it again later in this post.
Asset Sensitivity
Asset sensitivity refers to a balance sheet structure where there is an asset liability mismatch and the assets re-price or reset faster than liabilities. This means that interest rates on liabilities are locked down for longer periods of time when compared to assets.
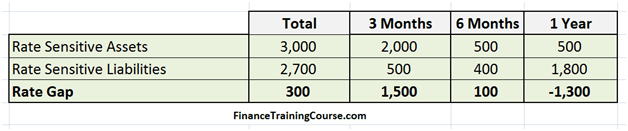
The balance sheet presented above is an asset sensitive balance sheet. Can you see why? 2.00 billion of the 3 billion in asset resets faster than the 1.8 billion in liabilities placed in the 1 year maturity bucket.
Under what projected interest rate conditions would you want your balance sheet to be asset sensitive?
Also, note that in this instance the 3 and 6-month buckets show positive gaps while the 1 year bucket shows a negative gap.
Gaps, Sensitivity & NII Earnings Impact
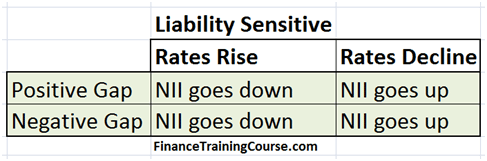
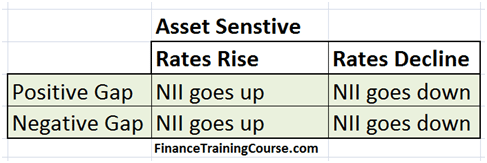
In order to completely understand the interaction of NII with the dimensions we have defined so far, we have to list them down. There are three dimensions – the nature of gap (positive or negative), the direction of interest rates (rising or declining) and sensitivity (liability or assets).
The three dimensions lead to 8 possible scenarios of impact on NII – all listed below under the two headings of asset and liability sensitivity:
Asset Liability Mismatch. Liability Sensitive Balance Sheet
We will now quickly go through 6 of the above eight scenarios. We will use the same default liability sensitive balance sheet across all scenarios unless stated otherwise.

The NII calculation for the default base case will also remain the same.
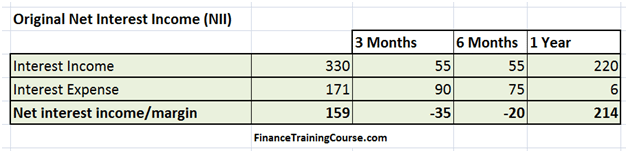
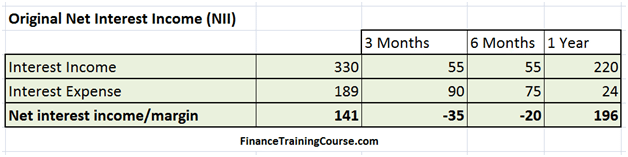
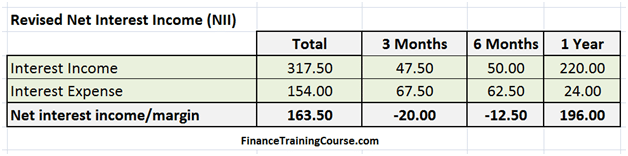
The base case as well as rising rates scenario is presented below:
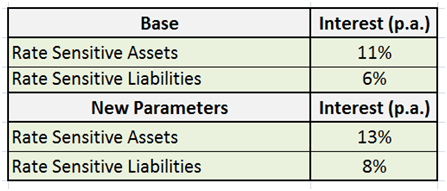
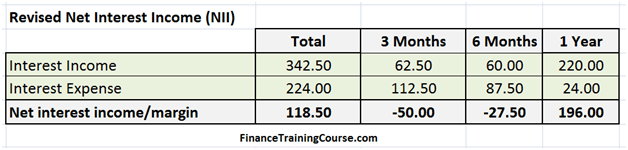
Using the approach shared and described in our earlier posts on NII, when we recalculate NII for rising rates we end up with the following exhibit.
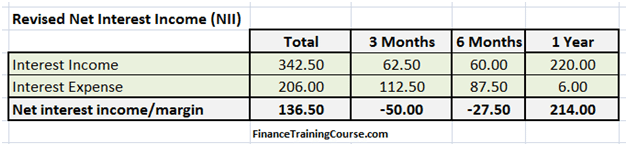
As predicted, on a liability sensitive balance sheet with a positive gap, as interest rates rise, NII will decline. Our base started off with an NII estimate of 159 million. After incorporating the impact of the rising interest rate, NII declines to 136.5 million.
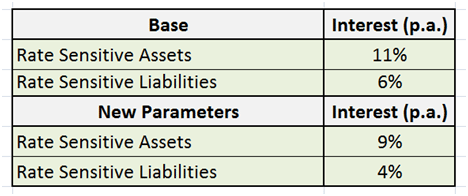
We then repeat the calculations again for a declining interest rate scenario. The base case and default balance sheet remain the same, we only change the interest rate outlook to end up with the revised NII figure for falling interest rates.
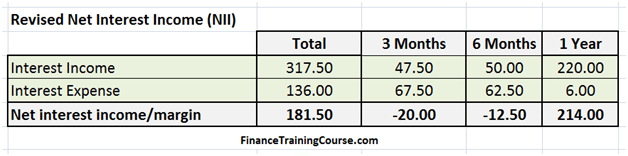
As forecasted, NII rises from 159 to 181 million under the new scenario with a liability sensitive balance sheet, a positive gap and declining interest rates.
Similar trends hold for a negative gap. But we need a different balance sheet to showcase the interaction of the negative gap.
And a different base case set of calculation results for NII
The interest rate scenarios remain the same. The results are summarized in the next four images.
Asset sensitivity – Homework assignment?
Since we have blitzed through 4 of the 8 scenarios, there is only one way to ensure that you have understood the core concepts presented in the post above. Using the same tools and approach repeat the above exercise for an asset sensitive balance sheet. To make things easier we will even provide you with hints for the first two combinations. Go ahead and figure out the solution.
While you craft a solution also think about how each of the above scenarios corresponds to a given interest rate outlook. Rising rates recommend which flavor of sensitivity and gaps? How does that differ from declining rates? What happens when your mix-and-match strategy goes for a toss when interest rates fail to oblige by doing the opposite of what was expected?
All this and more in our next post in the series on ALM refreshers.