The two elements used within bank ALM analysis are Economic Value (EVE) and earnings as given by Net Interest Income (NII). Why do we emphasize earnings or NII in banking more than value? What is wrong with value analysis? The following post evaluates this conundrum.
Tools to assess interest rate change impact
In the ALM world, we use two tools to illustrate the impact of interest rate changes.
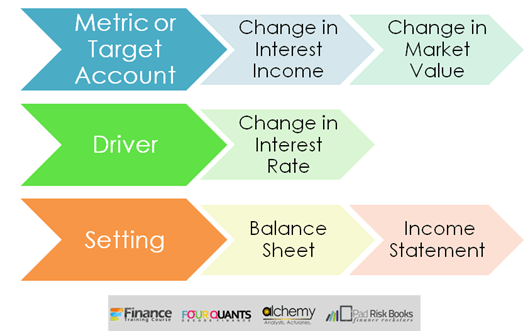
a) The rate or reset gap focuses on the impact of interest rate changes on earnings. Rate or reset gap buckets assets and liabilities based on the next rate reset window. A loan with five years to maturity but with a floating interest rate that resets next month will slot in the up to one-month maturity bucket.
b) The price or maturity gap focuses on the impact of interest rate changes on shareholder value. Price gap buckets assets and liabilities based on the residual contractual maturity. The same loan with 5 years to maturity mentioned above will slot into the 5-year maturity window.
Let’s repeat this once again for emphasis. Rate or reset gap for earnings, price or maturity gap for balance sheet impact. Which one should you use? Which one of the above do the bank’s Board of Directors and executive teams focus on?
This is where our discussion begins to get interesting.
NII in Banking – Rate or Reset Gap
The rate or reset gap analysis assumption assumes that with changes in interest rates you will be able to change the applicable reference rate on both your deposits as well as on your loans. While this may be possible in very liquid markets, in a number of emerging countries the balance of power continues to shift between banks and large depositors. Liquid markets tend to shrug rate re-pricing away as an accepted market norm. However, in illiquid environments, the balance of power continues to shift between large depositors and borrowers and the banking system.
While the assumption may not hold completely, it is generally taken as relevant and the analysis generated on the basis of this assumption is not questioned heavily in the board room.
The ALM reporting tool we use for analyzing earnings using rate or reset gap is the Net Interest Income at Risk or NII at risk report.
Economic Value – Price or Maturity Gap
The core assumption behind the price and maturity gap is a mark to market (MTM) of both sides of the balance sheet using the new applicable reference rate. MTM is the fair market value of assets and liabilities based on the most recent changes in the interest rate environment.
Think about that for a second. Can you go to a depositor and tell him that yesterday’s 1,000 dollars deposit is now worth 900? The short answer is no. Even though the opportunity cost argument holds, most bank regulators and depositors will not look kindly upon such a practice.
But that is deposits. On the advances side, a working capital/running finance/overdraft facility that resets rates every month and has a year to maturity is classified in the annual bucket. In most markets even after you call the loan, the collection process may extend over a few years. From a liquidity point of view, the underlying assumption is that the amount in question will be repaid within a year. From a real world point of view, it may actually be a few years.
The only part of the bank’s balance sheet that can be truly fair valued are market related assets and liabilities. Publicly traded securities that the bank holds on the asset or liabilities side. Everything else is debatable and fair game. One could make the argument that in a due diligence situation, fair value analysis becomes important but that too is a function of the franchise of the bank being sold. Some acquisition teams may push aggressively on the MTM of listed and traded securities. Others may ignore the impact based on the materiality of the discount.
The ALM reporting tool to analyze economic value, using price or maturity gap, is the Market Value of Equity at Risk or MVE at risk report. The report essentially using the Duration gap analysis to mark to market the balance sheet. For these reasons sometimes we call MVE analysis, the DGAP analysis.
NII in banking (earnings) or economic value (EVE)? Which one would you choose?
Regulatory and investor disclosures may require the bank to share and present both earnings and value impact. However, the primary focus of analysts, executive teams and bank boards are on earnings.
There is certainly a short term bias in the analysis. The earnings presentation gives analysts as well as the management team the information they need to fine tune their forecasts. Compared to earnings sensitivity, Duration gap analysis (DGAP) is a more recent arrival. More importantly, the set of assumptions behind earnings analysis is less questionable than the assumptions used in the value analysis. The value analysis is still dissected but it is a thicker, bigger, rougher cut that is dependent on a few questionable assumptions that are difficult to defend in an ALCO session.
The earnings analysis is more fine tuned and is used more commonly. Let’s take a quick look at the reporting template and some of the calculations.
Earnings analysis using the Net Interest Income at Risk reporting template
To introduce the Net Interest Income at Risk reporting template we will use a simplified stylized case study.
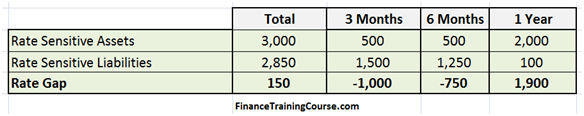
Our stylized bank has a simple balance sheet distributed across three maturity buckets.
- Up to 3 months maturity
- Between 3 months and 6 months maturity
- Between 6 months and 1 year maturity.
Here maturity buckets refer to the amounts of time remaining before the relevant reference rates for all items in the bucket reset.
All figures presented in the stylized example are in millions. There is only a single line item for rate sensitive assets and liabilities.
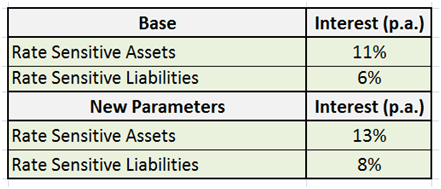
There is a single reference rate for all assets, irrespective of maturity buckets. Similarly, there is a single reference rate for all liabilities, irrespective of maturity buckets. Expected rates increase is about 2% for all assets and liabilities.
Net Interest Income – Base Case
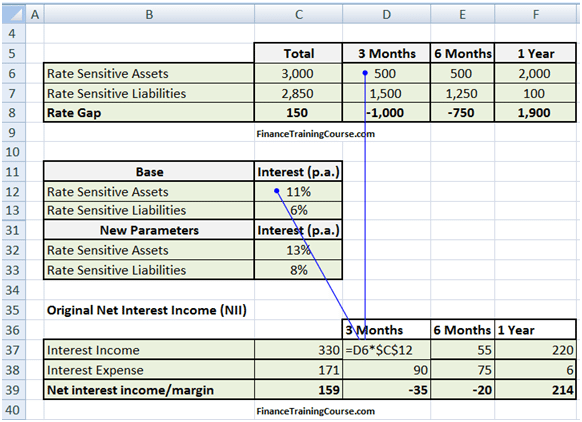
Based on the information shared so far we do a simple calculation to determine the interest earned and expensed across maturity buckets for assets and liabilities. The results are below:
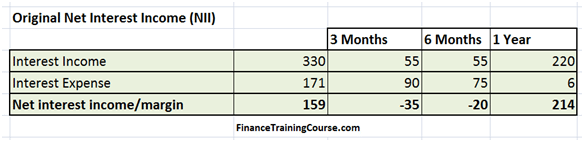
For each cell above we take the balance in the maturity bucket and multiply it with the reference rate. Our assumption is that the reference rate is applicable for the remaining part of the year. Whenever the reference rate changes, the underlying assumption would be that it would stay applicable for the next 12 months.
Base Case formula
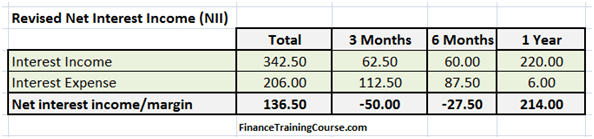
The formula used for calculating interest is:

The implementation in Excel is as follows:
Revised NII Scenario – Rate Increase
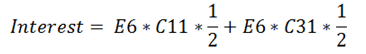
To calculate the revised NII figure after the projected rate rise, change the relevant reference rate and recalculate interest income and expense figures using a slightly different formula.
Because of the change in interest rate, there has been a shift in net interest income. Despite the rate increase, the projection for net interest income is a decline from 159 million to 136.5 million. Why is that?
The explanation is simple. When you look at the structure of the balance sheet you see assets invested in the relatively long term. Hence, they are relatively immune to changes in interest rates. However, liabilities concentration is in the shorter term and they re-price much faster than assets. This balance sheet structure is a liability sensitive balance sheet. Liability sensitive because liabilities re-price faster than assets. We have a liability sensitive balance sheet. When rates rise, a liability sensitive balance sheet will generate a declining trend in net interest income.
In our next post, we will spend some more time on the interaction of gaps, asset and liability sensitivity and net interest income at risk trends under rising and declining interest rate environments.
Revised formula
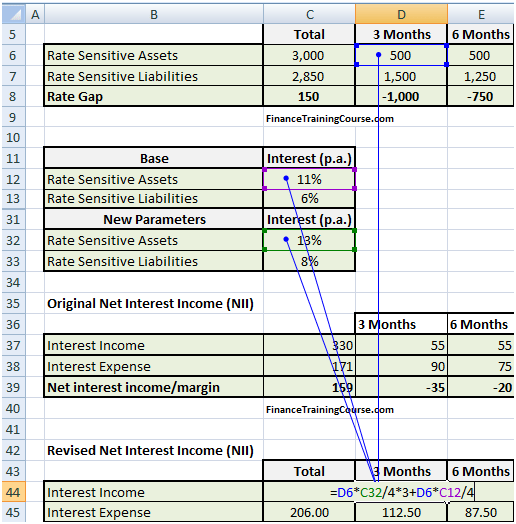
The change in the formula for interest income and expense now accounts for two rates. The old rate applicable to the first part of the year and the new rate applicable for the remaining part of the current year. As our analysis has a one year limit, there is no change in the calculation for the one year bucket.
For the 3 month bucket, the relevant formula for calculating interest income or expense is:
D6 is the cell that links with the amount in the maturity bucket. C11 and C31 are the old and new reference rates.
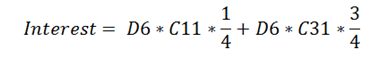
Similarly for the six month bucket:
E6 is the cell that links with the amount in the maturity bucket. C11 and C31 are the old and new reference rates.
The Excel implementation is as under:
Benefits of the NII at Risk template
The Net Interest Income at risk template quickly gives you a heads up on projected changes in your earnings outlook based on a change in the interest rate environment.
Given its simplicity and ease of use, the template is relatively simpler to explain to the executive committee and board of directors members and after a few iterations of usage, interpreting results also becomes easier.
In our next post we take a more detailed look at the interaction of gaps, sensitivity and impact on earnings.
(This post is part III of a five part series on better understanding ALM strategies from a board of directors and executive committee members point of view).
