Testing Facebook Fan page reach versus Google+ conversions
Tired of reviewing, writing and editing content over the last 6 weeks, this weekend I decided to run a slightly skewed social experiment. I had always wondered about the practical reach of my social network fan pages and over the month of June I had been tweaking my approach of sharing new posts on that network.
Testing Social reach and conversion – The trial post
So yesterday I ran a side by side comparison of a single post first made on our Google+ property, followed by the same post made on our Face book fan pages a few hours apart. Both posts used exactly the same template and formats. An image, a link and a less than 100 word description of what the post was about followed by a call to action. We have a new book coming out on option Greeks in December 2014 and the posts announced the availability of an extract for download during the month of July. The download includes a formula, calculation and usage convention reference, just the sort of thing you could use to review for an upcoming exam.
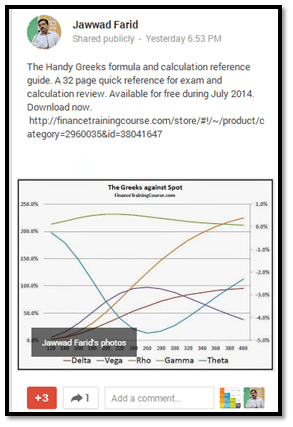
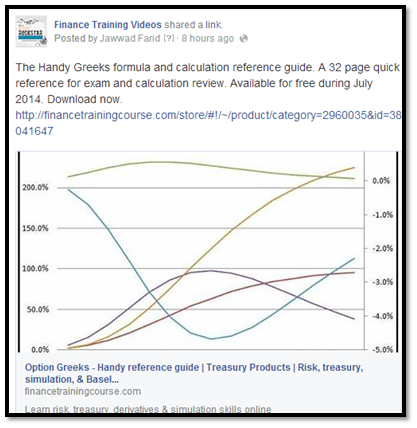
Let me be the first to admit that I am not a reach or Face book advertising expert. The sum of my knowledge is a handful of books and a few dozen advertising and page promotions campaigns I have run over the last two years on my pages. And based on that knowledge let me also acknowledge that by any standard of design and reach, both the above posts sucked in terms of presentation and approach. But this is just the thing a small business owner like me is likely to try without any available external professional help.
Testing social reach and conversion – the properties
My oldest property is the FinanceTrainingCourse.com fan page on Face book. With just over 7,300 fans it is a page that has been around for the last three years. But that number is misleading. Depending on the nature and type of the post, an ordinary run of the mill post barely reaches 500 fans. God forbid if we add an external link, the numbers fall drastically to double digits. Even if you run focused, targeted campaigns aimed at markets and customers you would like to work with, the quality of traffic over the last few campaigns has been terrible. The challenge lies with the type of content we publish and share. Broader themed posts on starting up, pitching, competing in business plan competitions and relevant social themes including politics do well without any advertising spend. But if you start putting out posts on options Greeks, Simulation models or Black Scholes derivation (a niche market with limited appeal), you hit total silence. Even on a fan page dedicated to that topic.
Images, photos and album shares do well. Links do not. Posts shared on the personal network do well, posts shared on the Fan pages bomb.
To simplify if I assume that my entire extended personal Face book network liked the FinanceTrainingCourse.com fan page, that accounts for a third of the total audience. The remaining 5,000 plus fans must have signed up because they like the topic. But that doesn’t reflect in reach. One big part of the reach issue is how Face book allocates posts to fan timelines. As a paid sponsor of the post you have limited control over that distribution. And when you try paid distribution, with some control, the incoming traffic doesn’t fit well with your specified filtering criteria.
I know I have tried. The effects are extreme because of how specialized and awkward the content is. And maybe that is where the problem lies.
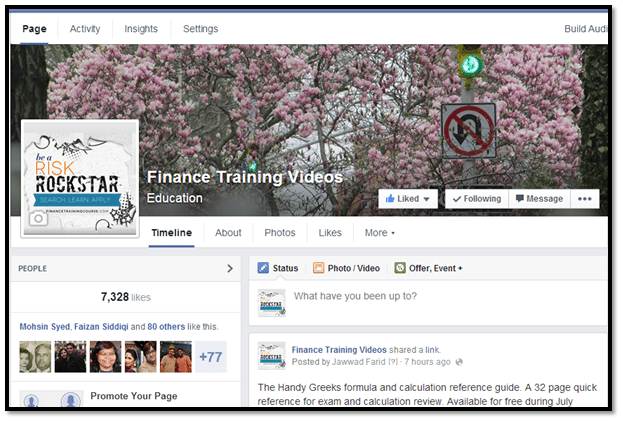
Figure 1 The FinanceTrainingCourse.com Fan page on Facebook
My second property is my personal Google+ page. No fans, just 2,491 followers.
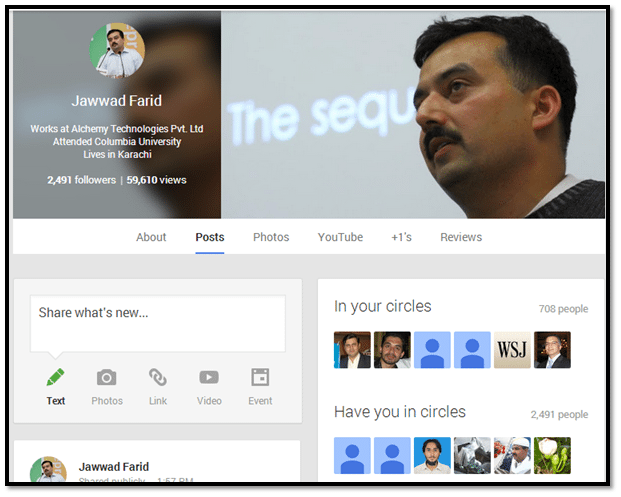
Figure 2 The Google+ personal page for Jawwad
The Google+ page also feeds the official FinanceTrainingCourse.com company page. This third property has just over 2,100 followers.
Figure 3 The Google+ company page
The experiment
Let me be the first to admit that from a design point of view the experiment is flawed. It wasn’t possible to isolate traffic from all other sources and there is a possibility of overlap with a number of external drivers of traffic. There is also the timing effect. The posts were not shared on the same time slot or the same day of the week. However when we get to the results you will see why we still wrote this post.
We first posted on Google+ and then streamed the post on the official company page. Not a direct post, just a share. We then tracked conversions on the primary site for the next 5 hours. The post was also streamed on the official company page. So total exposure was about 4,300 fans on the two Google+ pages.
Conversion was defined as a visitor signing in, leaving his email address and downloading either the offered content or other related free samples from the site. Each downloaded file counted as a conversion. Then after a lag of 5 hours to account for any lagging sales, we posted the same content on our Facebook fan page. Total exposure 7,300 fans. We let the post linger on the page for the next 12 hours before we stopped tracking conversion results using Google Analytics.
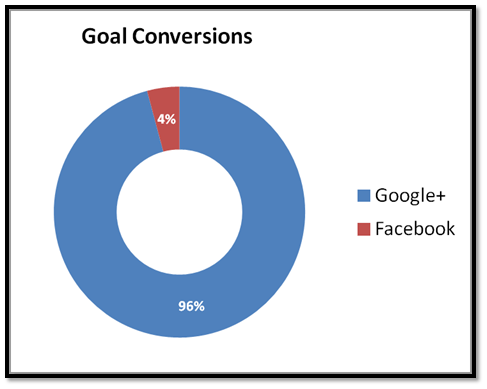
The results
The results were not unexpected. The Google+ post led to 23 conversions (file downloads) and 4 new customers in 4 hours. The Face book fan page post led to a single conversion and 1 new customer in 12 hours. Is that what you expected? What has your experience been like on the two platforms?
I am planning on running this again using more controlled conditions and a better experiment design. I would love to hear your feedback on what we can do to make this a more legit and credible comparison. Till then…