Economic Capital Case Study – Banking Sector
The best way to illustrate our shortfall economic capital model is to walk through an extended case study. Here is our plan.
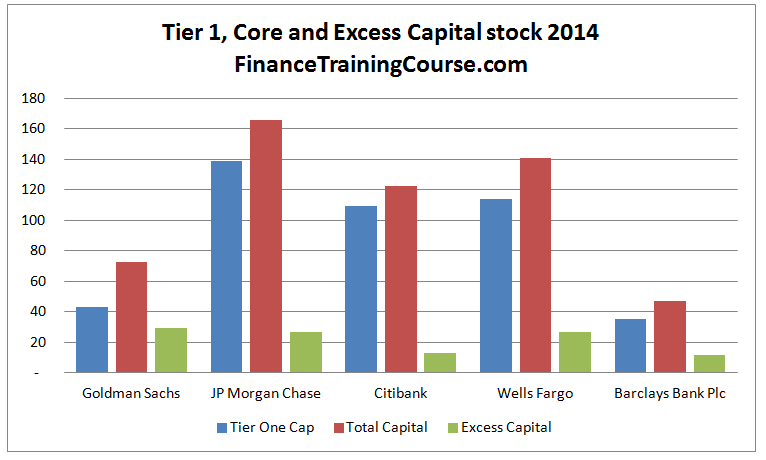
Let’s take a look at five financial institutions. Goldman Sachs, Citibank, JP Morgan Chase, Wells Fargo and Barclays Bank.
Citibank, JP Morgan, Wells & Barclays are wholesale banks with a strong retail and commercial banking franchise. Goldman is a leading investment bank with as much exposure internationally as the other four but the core business for Goldman is not retail or commercial banking. The first four are US based. Barclays is the only British/European bank in the list.

While JP Morgan and Wells Fargo did well during and after the financial crisis, others have not. Citibank and Barclays have been in and out of trouble and Goldman had a narrow brush with mortality during the financial crisis. JP Morgan has had a hiccup with London Whale and the FX rate fixing scandal.
How do Goldman Sachs, Citibank, JP Morgan Chase, Wells Fargo and Barclays Bank differ from each other when it comes to economic capital requirements. Can the same economic capital algorithm work for all 5 banks. More importantly can we build that model by just using publicly disclosed financial information without getting insider level access at the business line level?
Our initial perception based on raw regulatory capital requirements suggest that everything is well under control. Citibank and Barclays could potentially do with a bit more capital but Goldman, JP Morgan and Wells Fargo are apparently running a tight ship. In terms of strength of capital stock we would rate JP Morgan the highest, followed by Wells Fargo and then Goldman. But is that really the case, are these banks as well capitalized as we perceive them? How do the three different approaches used in the case study assess their capitalization?
But are these perceptions correct? Would this order change when we switch from regulatory capital to economic capital. These are the questions we will try and answer using our Economic Capital model case study.
Dataset and methodology
We use data from publicly available quarterly financial statements for our five banks starting with 2002 and ending with 2014. For Barclays the information was available on a semiannual basis and the Barclays model has been adjusted to reflect that gap.
The 2002 – 2013 dataset is available at ycharts.com. 31st December 2013 and Q1 and Q2 2014 information has been sourced directly from investor relations sections of each bank’s website.
We use the return series methodology (see Annexure to this chapter) to calculate quarterly returns for each bank. The return series is plotted using a histogram to get a sense for the underlying distribution and is also used to estimate volatility within the series. Volatility is used to then estimate distance to threshold which in turns is used to calculate probability of intervention.
We begin with the Shareholders equity data series but we will also take a look at the Net Income series before we wrap up our analysis.
Economic Capital – Methodology origins and foundation
Enterprise models for estimating economic capital simply extend the regulatory value at risk (VaR) model. The theory focuses on anchoring expectations. If institutional risk expectations max out at 97.5% then 99.9% can represent unexpected risk. The appealing part of these logistics is that the anchors can shift as more points become visible in the underlying risk distribution. In the simplest and crudest of forms, here is what economic capital models suggest
“While regulatory capital model compensate for expected risk, economic capital should account for unexpected risk. The difference between two estimates is the amount you need to put aside for economic capital modeling.”
The alternate approach builds up on the foundation set by probability of ruin, expected shortfall and Merton’s structured approach. Merton’s structured approach is a well documented and established methodology for estimating probability of default. The approach is the center point behind Moody’s KMV engine. We use a few tweaks and hacks on Merton’s structured approach to build a model that can be used to estimate economic capital for a bank using worst case losses, volatility in accounting measures as well as leverage ratio.
For a more detailed treatment of Merton’s structured approach see the following two posts. Calculating probability of default using structured approach and Barclays Bank – PD trend using structured approach.