Saudi oil strategy. How low can they go?
The opinion on Saudi oil strategy is divided. Planned mayhem and chaos in exchange for market share versus an over played hand. While we may all have some beef with Saudi Arabia, smart money when it comes to oil is betting on the house of Sauds.
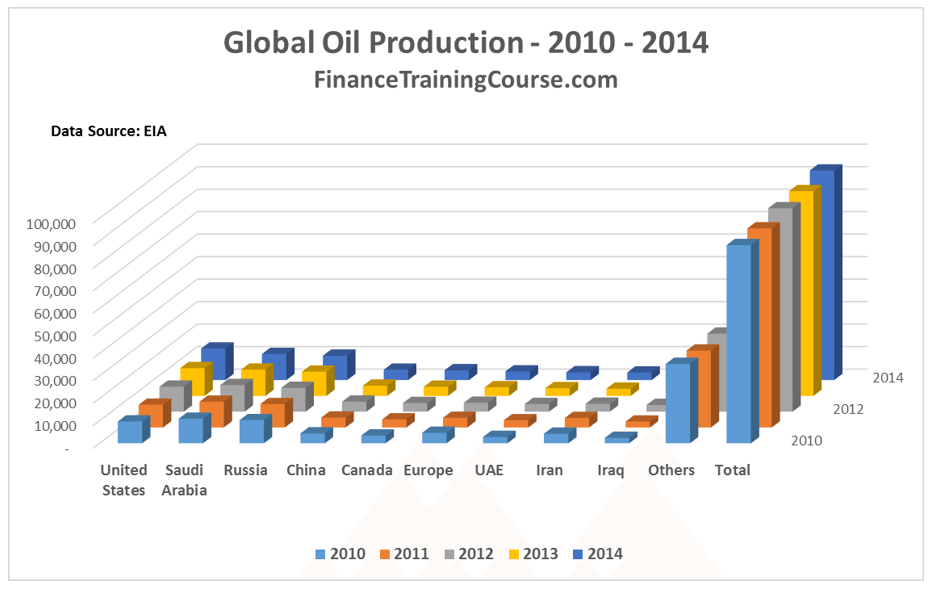
The top three crude oil producers in the world may switch places with each other every alternate year but their names remain the same. The US, Saudi Arabia and Russia together control 30 – 33 million barrel per day of crude oil production directly. When you consider Saudi and US influence over other regional producers, the first two collectively control over 52% of global oil production.
While the Russian Federation has been caught in an awkward bind, the Saudi play, especially given the macroeconomic context appears to be planned out well. They were dealt a good hand but they have outdone themselves in its execution.
Before the US leapfrogged them, Saudis were the only player that everyone cared about. Not because of their regional influence, or their stature, or their stance as tough negotiators but because of marginal capacity. They could add a million barrels a day (which they did as soon as Libya fell apart). And they can take it off the market just as quickly. Peak Saudi production was clocked in March 2015 at 10.3 mbpd. The earlier peak was recorded in the 1980’s. Saudi estimates and statements in the past suggest that they may have an additional million bpd of spare capacity, perhaps more. But the estimate can not be independently verified. With Iraq and Iran adding an additional million barrels of production to the supply mix over the coming years, total spare capacity within OPEC may range between 1.5 million bpd to 2.5 million bpd.
In the oil business you don’t want to cross the Saudis. They have been players in this market before the 80’s and understand it far better than anyone else.
With this background think about the recurring themes you see in recent media coverage about Saudi outlook.
- The Saudis have over played their hand and are ready to blink.
- The Saudis are eating through their hard earned foreign currency reserves and are worried about domestic push back.
- The Saudis are considering breaking the peg with the US$ to ensure that the Saudi Riyal goes a little further in these tough times.
- The Saudis are considering cutting down production to finally prop up prices.
The underlying tone in all such pieces has a subtle hint. The Saudis are caught in a hard place. They no longer want to play this game. They are tired, lost, possibly confused about what to do next. They want to go home. Hence hope that the current chaotic morass that calls itself the crude oil market will correct itself soon when the Saudis finally come to their senses.
We have already seen Russian and Chinese national balance sheets before we started working on Saudi Arabia in earlier parts of this series. Politely put, they look like train wrecks compared to Saudi figures.
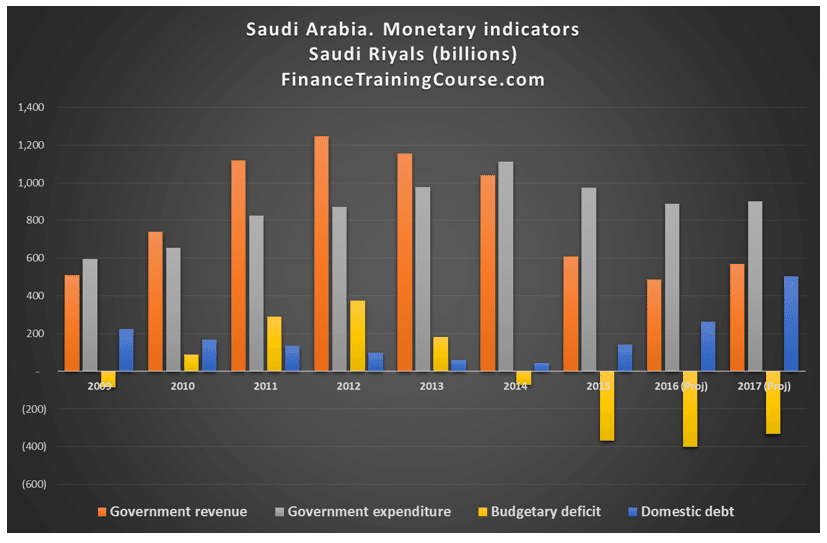
Unlike everyone else the Saudis planned well for the hand they have played. They have been stock piling cash and assets and building reserves from 2010 while the world went on a crazy value driven shopping spree. The Saudis did splurge a bit as the Arab spring hit, but it was domestic money spent within the kingdom. All in all a very restrained performance that allowed Saudi Arabia to put together a war chest of over 730 billion dollars by the time they went public with their stance in November 2014. A lucky accident perhaps?
The accident thesis is not supported by the trade figures leading to 2016, which pose additional interesting questions.
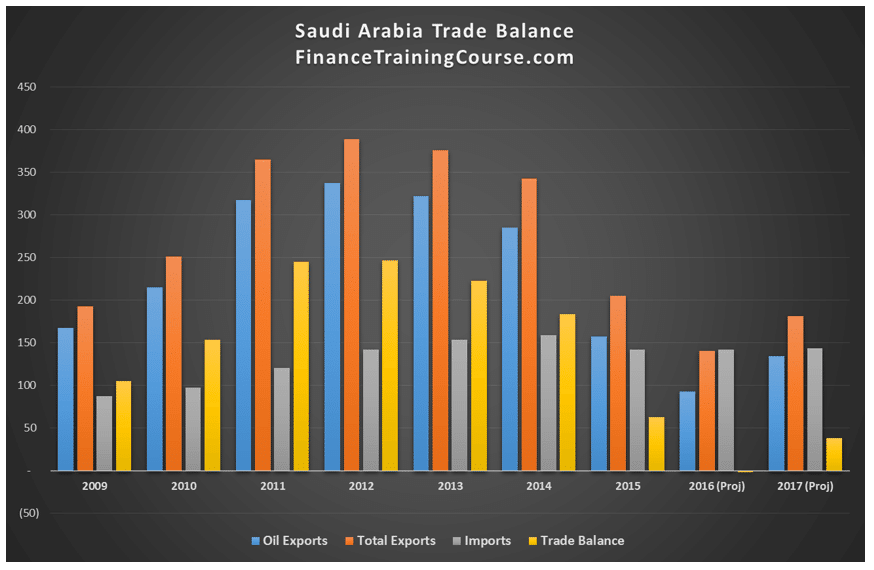
Despite bumper years by any account in ’12, ’13 and ’14, Saudi imports barely budged. There was no splurge. Which made it possible to manage the pain when the shortfall in revenues hit in 2015. Like the Russians the Saudis also lost 200 billion dollars in export proceeds in a single year. Seventy percent of their export base disappeared in 2015. Is there any other country in the world that would come out looking pretty in such a scenario? Saudi monetary and trade indicators did. They are still standing because of the restraints shown in the years leading up to the decline.
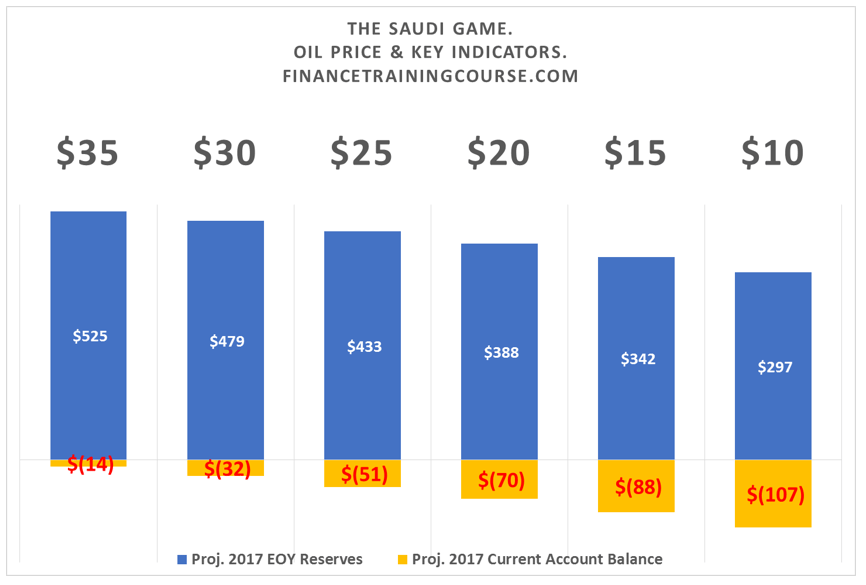
What about the future that is already here? In the image above the 2016 and 2017 projections were generated at a 5 dollar discount to Brent for the Arab blends sold by Aramco. US$30 was used as the average price of Brent for 2016, marking the Arab blends for sale at $25 a barrel. 2017 figures assume an improvement of US$11 in market prices compared to 2016 values. Actual discount to Brent on Arab blends is lower but we have assumed additional competition from Iran, Iraq and Russian for European and Chinese market share and lower demand.
For both years there is no significant contribution from the trade balance; there is also no significant burden on account of the trade balance. While it is true that positive trade balance allows Saudi Arabia to feed domestic expansion as well as maintain its regional foreign policy clout, for both years Saudi Arabia’s two big challenges would be the outflow of expatriate remittances and local subsidies required to maintain peace at home.
The Saudi response has been a mix of tools. A hike in domestic fuel prices to lower the burden of subsidies, a shift to Natural gas for power production, freeing up additional crude for sale, an active domestic sovereign debt program to bridge domestic consumption and expenditures, international bond sales to reduce the burden on reserves, efforts to diversify exports and increase downstream petrochemical sales and a draw down on reserves to balance everything else off. Keeping our forecast period to two years, when we plug all of these in, how low can Saudi Arabia go?
To answer this question we built a very crude Saudi Arabian economic model and put in even cruder assumptions. Good current data no Saudi Arabia is a little hard to find but we had some help from Saudi Investment houses and their research. It’s not Noble prize material but it answers basic questions.
Our basic question:
Where will the vaulted Saudi Arabian Reserves stand after two years of pain on January 2018? Also what would be the current account deficit for the same year?
Rather than use a single price for the discounted Arab blend, we took a range beginning from $35 all the way down to $10 a barrel. Remember this is Arabian crude and it expects to compete with both Iranian Heavy and the Ural blend sold by the Russians. Which means that the equivalent range, the underlying price for Brent, for the purpose of this analysis would be $40 to $15.
The graph above presents the results of that simulation. With Brent trading at $15 dollars for a full year, the Saudis will still have $300 billion to flaunt post December 2017. The current account figure won’t be pretty at -107 billion dollars but would be comfortably supported for another two, possibly three years by their reserves. And that is the Saudi worst case. The best case is somewhere in between. Where sanity prevails but marginal producers don’t. Where dropped market share is picked up by discounted cargoes. They just have to stand longer than every one else and with numbers and projections like these it appears that they can.
Yes there have two back to back credit down grades and talks of more by the same rating agency. Also talks of walking away from the US dollar peg because the dollar no longer needs the Saudi support. 5 year Saudi Credit Default Swaps spiked after both credit down grades and have not as yet returned to their original level. By all standards of market precedent and convention there should be blood in the waters. But there isn’t.
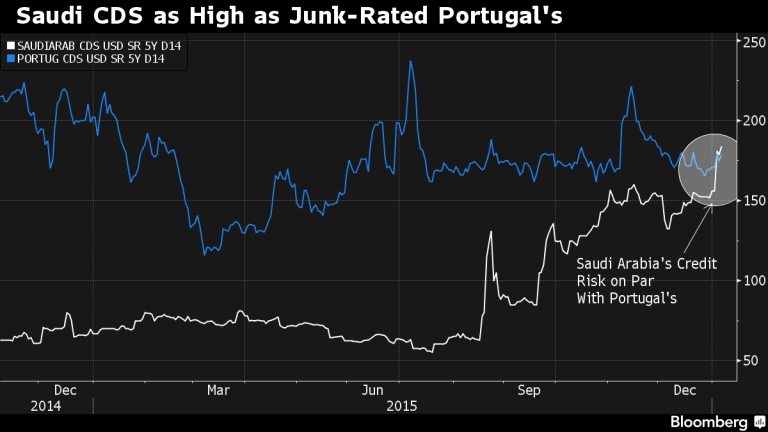
There isn’t blood in the water because the Saudis are neither lost nor confused. Nor repentant. They are following a script. A planned one. We don’t know what the plan is but whatever it is, it didn’t happen at the spur of the moment in November 2014.They are here because they want to be here. Nobody has forced them. And they will stay for as long as they want to. They can very well afford to because they ran the numbers before they left home. And the numbers work. Don’t be fooled by the act. When it comes to oil, we are neither in the same league, nor in the same room.
In the desert and the oil patch memories run longer and blades run sharper.
Updates and related news:
24th Feb 2016. The oil production freeze begins to unravel.
25th Feb 2016. ND’s largest fracking firm suspends production.
26th Feb 2016. Wither Shale producers? It’s interesting to see how the tone of coverage changes from one day to the next. The hype around oil production cut (sorry production freeze) barely dies down and we start seeing coverage on an involuntary reduction of 800,000 barrels by shale producers over the next two years. Point to remember and note. Not all shale producers are created equal – some producers are still profitable at $40.
16th April 2016. Is Doha driving oil prices up?
17th April 2016. Has the Saudi strategy created a monster? US Rig count, Rig productivity and crude oil production.
22nd April 2016. Who will speak for the Kingdom?
See the complete series on dissecting crude oil at The knives are out in the oil market.