A quick review of common liquidity gap implementation challenges as part of the bank asset liability management platform implementation.
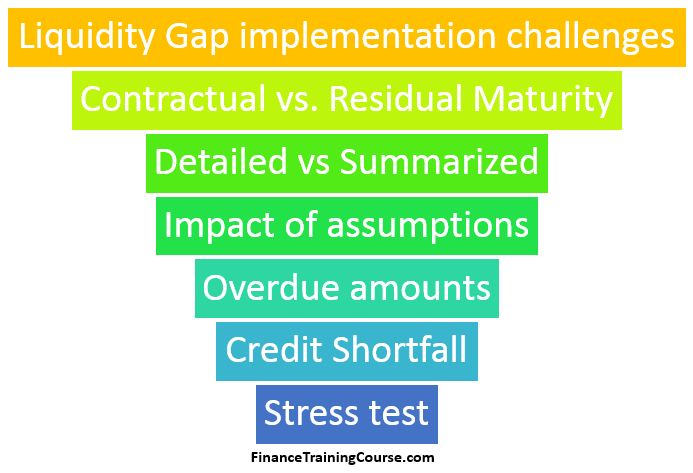
What is Liquidity Gap?
The liquidity gap reports presents a summarized view of the bank’s balance sheet by breaking total assets and liabilities into accounting line items and maturity buckets. Even with the right asset liability management platform liquidity gap implementation is sometimes a challenge.
A typical implementation includes:
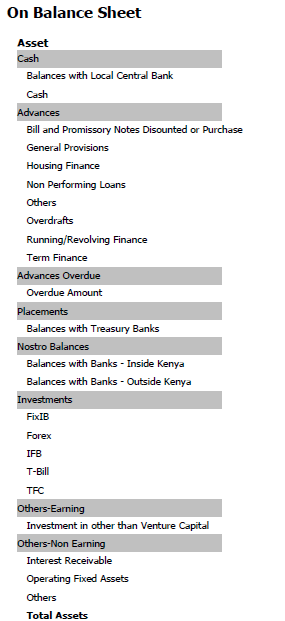
- On the asset side accounting line items would include a breakdown of assets by liquidity beginning with cash, liquid securities and investments and ending with other assets.
- Similarly, on the liability side, the report shows a breakdown beginning with current deposits (shortest maturity) and ending with term subordinated debt (longest maturity).
- All figures are broken into maturity buckets with exposures maturing within 0-1 day, 30 days, 60 days, 90 days, 180 days, 1 year, 3 year, 5 years, 10 years and a final bucket for exposures maturing in greater than ten years.
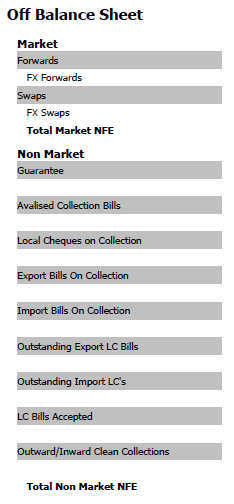
In addition to on balance sheet exposures, liquidity gap report also shows off balance sheet exposures. This includes non-funded trade finance transactions, forward exposures and guarantees. Off balance sheet exposures are important. It takes only minor shocks to the economic system for a non-funded off balance sheet item to convert into a funded on balance sheet exposure.
Why liquidity gap?
Within Asset Liability Management reporting clients often focus on or begin with the Liquidity Gap report. The liquidity gap report uses residual contractual maturities. A five year loan with three years to mature is bucketed in the up to three year maturity bucket.
Liquidity Gap figures also feed related reports that also use residual contractual maturities for their calculation.
- The Price or Maturity Gap report includes the impact of interest rate discounting and marks to market the balance sheet using the current interest rate yield curve,
- The Duration Gap report calculates the impact of a static interest rate shock on shareholder equity, and
- The Market Value of Equity (MVE) or the Economic Value of Equity (EVE) report uses dynamic VaR based shocks to do the same.
With the revised Liquidity Coverage Ratio guidelines under Basel III, Liquidity Gap reporting has become more important. Liquidity coverage ratio calculations require the segregation of liabilities between stable and non-stable (hot money) sources. While there are a number of possible categorization approaches, in emerging markets the primary differentiator between stable funds and hot money is the deposit size and the interest or profit rate being paid on it. Compare these two metrics against the average figures across a specific product. Deposits that cross the single standard deviation threshold for one or both metrics may be classified as hot money. Higher rates and above average sizes tend to represent institutional or smart investor money. This is money that is mobile, extremely sensitive to credit profile changes and offered compensation (rates).
The old format liquidity gap reporting needs to add and include the revised Basel III categorization. The current template includes the break down between current, saving and term deposits. The revised templates will add stable and hot money categorization across all three deposit categories.
Detailed liquidity gap reporting
Liquidity gap templates come in two forms. Summarized and detailed. Detailed templates include product level break down. For instance, summarized reporting may only show one line item under investments. Detailed would show a break down across Placements, Treasury Bills, Treasury Bonds, Corporate Bonds and Other investments. Similarly, deposits under the summarize approach would only show a break down between demand and time liabilities. A detailed report would show additional line items by all liability products. The last item is the all-encompassing “Other items” category. A detailed template would show the breakdown of line items under the other category.
The impact of assumptions
Working with raw data at the account and contract level is a challenge. Even a midsize back may end with a million depositors and a few hundred thousand loans. While ETL layers for internal warehouses can make it possible to extract, validate and update data at a contract level it is only the beginning. Retail accounts on both sides of the balance sheet need to be pooled by product, remaining days to maturity, repayment frequency, rates and security (for advances). Pooled data needs to be reconciled to ensure that no errors have occurred during the pooling process. Once this is done we need to examine rollovers and growth.
With many products, actual contractual maturities are sufficient in terms of modeling impact on liquidity gaps. But with current accounts and overdraft, running finance and working capital facilities, account rollover is quite common. Hence the need for an assumptions override for rollovers and contractual maturities for current accounts, saving and term deposits as well as for overdraft, running finance and working capital lines. The assumption option should allow for a distribution of maturity behavior for an existing product across multiple maturity buckets.
For Internal Capital Adequacy Assessment reporting, it is important to also factor growth in the liquidity gap analysis. We can handle this can also through the assumption setup. But growth assumptions need to be set up on a quarterly basis.
Over Due Loans – Acceptable treatment
For overdue amounts on advances and loans we need to support two choices. The first choice is the assumption that while the amount is overdue, it will be paid within the next thirty days. The second choice is the assumption that the amount is overdue and will run through the standard work out and loan adjustment period.
The first assumption implies that the expected payment will arrive if not within the next thirty days then soon after. The second assumption assumes that it will be at least a year or more before we will see the relevant payment hit our accounts. Ideally, we should be able to handle this through the assumptions option described below. Where a portion of the overdue balance is allocated to the 0-30 day bucket and the remaining can be distributed across the remaining part of the years.
Contractual versus Residual Maturity
The original contractual maturity is irrelevant for liquidity gap purposes. The residual contractual maturity (the time remaining before the contract is due for payment or withdrawal) needs to be tracked and reported. For liquidity gap, rate or coupon reset period is of interest only if the client has the option for premature withdrawal or repayment at that point in time. Otherwise, for most reporting needs, residual contractual maturity is sufficient. This means that in addition to other specifiers of the contract we also need to calculate and report days to maturity (DTM).
Credit related shortfall and stress testing gap
Asset Liability Management reports focus primarily on the interest, liquidity and funding mismatch risk. Traditionally report templates do not include the risk of credit default and follow on the impact on liquidity. But sometimes boards want a consolidated assessment of liquidity and credit default in one template. While there is merit to both sides, the preferred approach is to do two separate reports. A pure liquidity gap report and a variation with credit default adjustments.
If you do want to model and include the impact of credit defaults there are a couple of questions. Are you going to predict defaults or use already classified loans? Are you going to use one figure or distribute it across maturity buckets? Will you do it across products (loans as well as investments)?
Simpler is better so our recommendation is to do a simple model using already classified loans. If you still need to model defaults just add another line item for total expected defaults. Bucket it in the first maturity bucket.
For stress testing purposes, especially on account of credit downgrades, once you have the ability to tag deposits, it would also be useful to generate two variations. One version of the gap with hot money on the liability side, one without hot money.