Market Volatility – Are markets more volatile today? 2016 edition.
I have been spending a great deal of time thinking about market volatility recently.
Market volatility has many faces but there are two specific ones that interest traders. If you trade options for a living, you are dependent on your ability to read the shifting sand of implied volatility. A wave here, a drop there. If you read them right, your touch is golden. If you don’t, you end up writing about it like yours truly.
The second relationship is a little counter intuitive. While higher volatility may lead to a bigger range across which prices move, shifts in volatility are often seen as trading signals. Traders buy options at lower implied volatility levels and sell them at higher implied volatility levels. Underlying prices tend to drift lower with higher volatility but option premiums rise with higher implied volatility and decline at lower levels of the same.
But I digress.
I had been thinking about volatility because I was wondering if the recent oil price volatility (November 2015 – April 2016) was in any way similar or greater than the waves we witnessed in 2008-2009 as oil prices traded between 147 and 33 dollars a barrel. I had been this curious once before in 2013. In November 2013 I had run some analysis on rolling volatility figures for the first time to see if the comparison held. It was time to update that spread sheet.
Rolling volatility tracks daily price volatility similar to a moving average using an observation period. Rather than a static measure of volatility rolling volatility allows users to understand how volatility is likely to behave (going up or down) in a given time period. Since it tends to behave in a cyclical fashion it can also be used as a trading signal.
Before I share the analysis and results a few qualifications on the data and methodology:
10 day rolling daily volatility versus 60 day rolling.
The 2013 analysis was based on 60 and 90 days rolling daily price volatility. I had also calculated the rolling figures using a discrete, non-overlapping non-biased method as well as continuous overlapping biased approach. For the 2016 figures I have only run the discrete unbiased rolling calculations and I have reduced the rolling period to ten days.
Adding CBOE VIX as a proxy for equity options
One common feedback on the 2013 analysis was the missing equity link. In this iteration I have included the volatility of CBOE VIX as a proxy for broad equity options trades as an asset class.
WTI replaced by OPEC Blend
WTI (crude oil) – the West Texas Intermediate blend has been replaced by the OPEC blend. We did this because while WTI futures have the most liquidity on NYMEX from a production point of view we wanted to give the most weight to physical producer prices rather than paper contracts. The closest proxy we could find to the largest share of physical market was the OPEC blend.
The OPEC blend is the reference price for the OPEC Crude Oil Basket. It currently includes: Saharan Blend (Algeria), Girassol (Angola), Oriente (Ecuador), Iran Heavy (Islamic Republic of Iran), Basra Light (Iraq), Kuwait Export (Kuwait), Es Sider (Libya), Bonny Light (Nigeria), Qatar Marine (Qatar), Arab Light (Saudi Arabia), Murban (UAE) and Merey (Venezuela).
Implied vs empirical
The numbers I have run are based on observable price data (empirical) and are not comparable with implied volatility figures for the assets classes discussed. One could run the same analysis for implied volatility.
The data set
Market prices from 1-Jan-2006 to 15-April-2016 (the most recent Friday). It missed the impact of the failure of the Doha talks and the fall out from the Kuwait oil workers strike on oil prices.
Multiple sources all collated through Quandl – the amazing free financial data set site. Assets included in the analysis include the OPEC Blend, the CBOE VIX, the EUR-USD and the YEN-USD exchange rates and the bullion prices for gold and silver on the London Exchange. Between crude oil (industrial and broad economic use commodity), Exchange rate, VIX (equity markets), and the two exchange rates (currencies) we have covered a narrow swath of the market. It would help if we could also add data for feeds and grains and other industrial commodities such as copper, iron and cement.
And now without further ado, the analysis and the framework used to run the numbers.
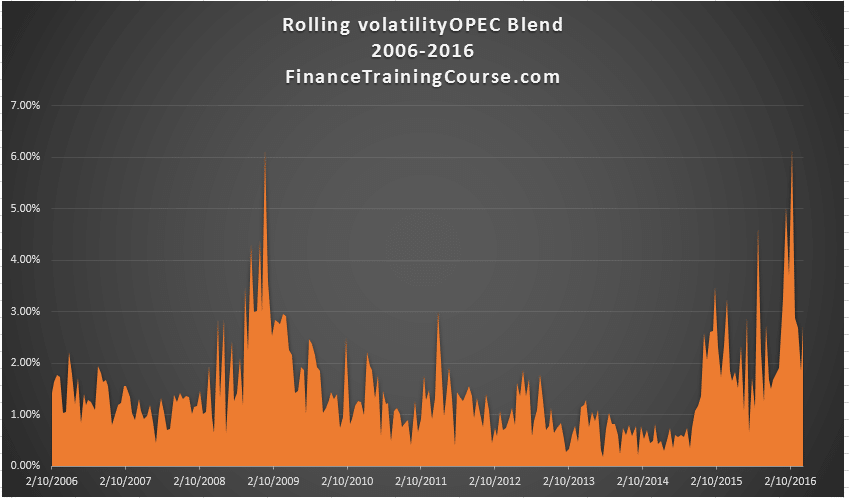
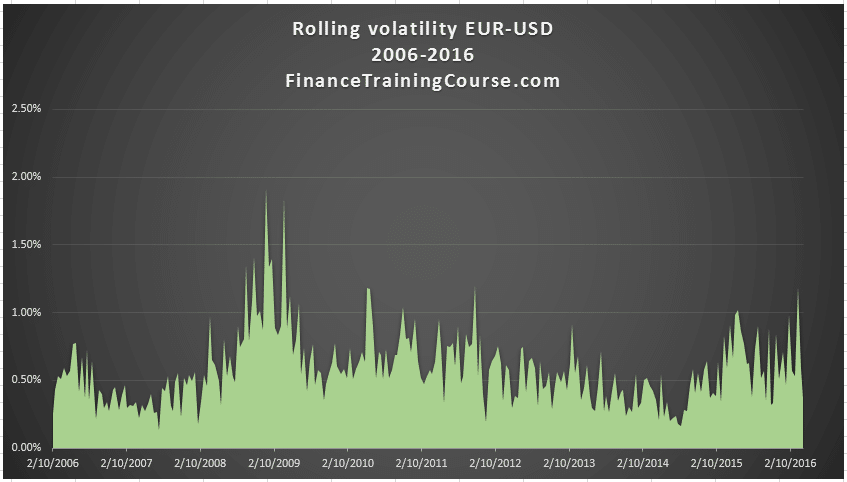
- We begin by measuring ten day rolling volatility (by applying the Excel stdev function on a ten day series of daily price changes).
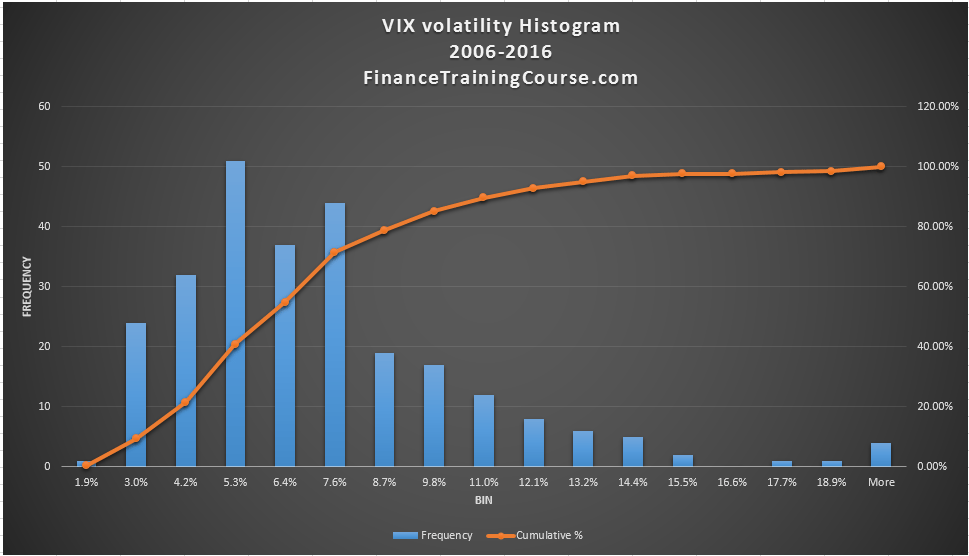
2. We then plot a histogram of rolling volatility to get a sense for the underlying distribution of market volatility. This gives us some indication of how low or high average price volatility can go for a given underlying.

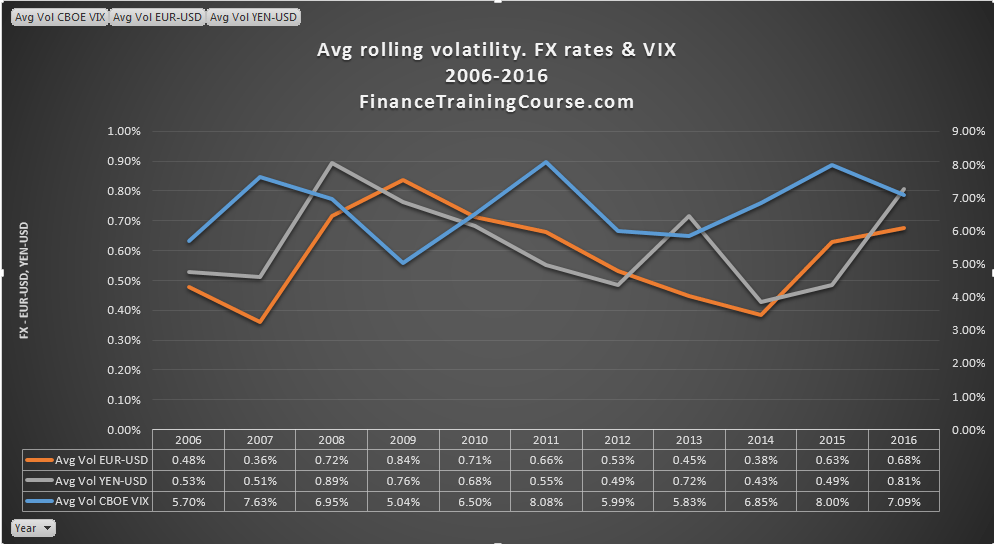
3. Followed by calculation of the average volatility across a given calendar year and a given asset class.

What does our analysis indicate? Are markets more volatile today?
The short answer is yes for crude oil. On a relative basis crude oil (in our case the OPEC blend) has witnessed significantly higher volatility in 2016 compared to the entire period of prior observation 2006-2015. Key point to remember. We are only looking at the average of ten day volatility across 100 days of data (Jan to April 15) for 2016. And our definition of volatility is essentially a moving average of a ten day series. Alternate measures of volatility may lead to a different conclusion.
The 2015 price shift in crude oil came a bit late and as a result 2015 volatility at 2.1 percent is halfway between the highs set in 2008 and 2009. For gold and silver the highs were set much earlier in 2008-2009 (gold) and 2011 (silver) and the daily volatility figures look subdued when compared to crude oil.

For currencies and CBOE VIX the results are also similar. VIX in 2015 was almost as high as 2011, which is when the last high watermark was set. For the two exchange rates highs were set in 2008 and 2009 and have have not been breached since then. So while equity markets have been behaving interestingly in 2015, they have not breached 2011 levels.
Among the four asset classes, FX markets on a relative basis have been the least volatile in 2016 when compared to earlier years.