US Rig productivity, rig count and US oil production. Relationship or paradox?
Pick up any news source and every week for the last few weeks you will see a mention of the steep decline in US rig counts beginning November 2014. From validating the Saudi oil strategy to the troubled storm front facing North American Shale oil companies, it is our favorite number to quote when it comes to the outlook for crude oil prices.

Diligently reported on a weekly basis every Friday by Baker and Hughes, this figure has become the flag bearer for the troubled oil patch. In fact a google search on Saudi Oil Strategy and US rig count pulls up 240,000 results on 10th April 2016.

So essentially media treatment and reactions suggest a reduction in US rig count is a leading indicator of future cuts in crude oil production because it is one key indicator of reallocation of capital across the oil industry.
But is it? Reallocation of capital yes, but reduction in crude oil production?
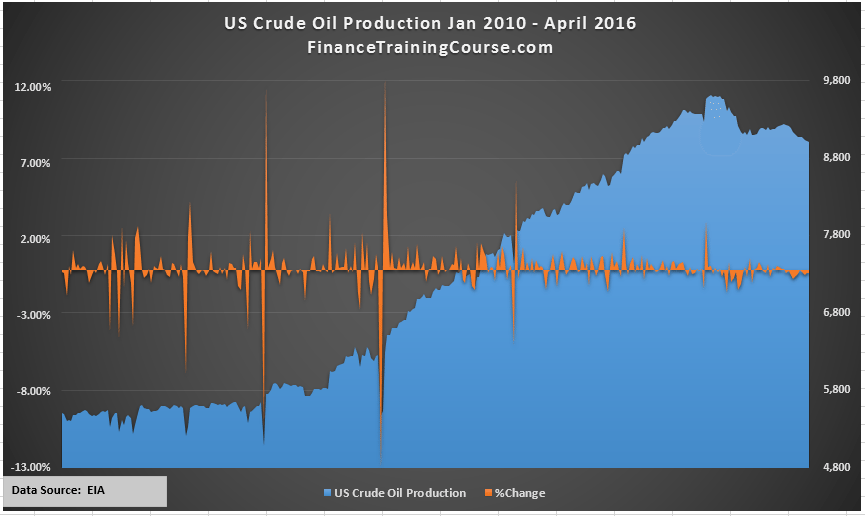
A quick inspection of raw rig count data collated with US crude oil production series brings up an interesting paradox. US crude oil production clocked a peak of 9.6 million bpd in mid 2015. The figures announced by EIA last week in April came in at just above 9 million bpd. A decline of roughly 15% over a period of nine months. What was the corresponding change in Rig counts that brought about this production drop? 15%, 25%, 30%?
To build the argument for a relationship between the two variable we should expect to see some kind of a proportionate reduction in both time series.
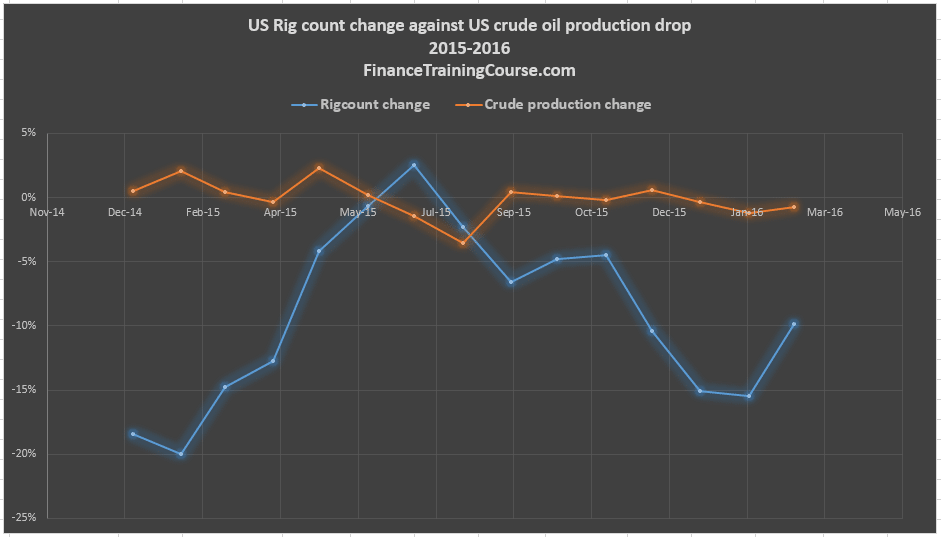
How about 76%. From 02 Jan 2015 count of 1,811 total US rig count dropped to 443 as of 8 April 2016. This includes 89 gas rigs so the actual crude oil rig count fell to 354. To put the steepness of the fall in context and the scale of the relationship, take a look at the next two images below.
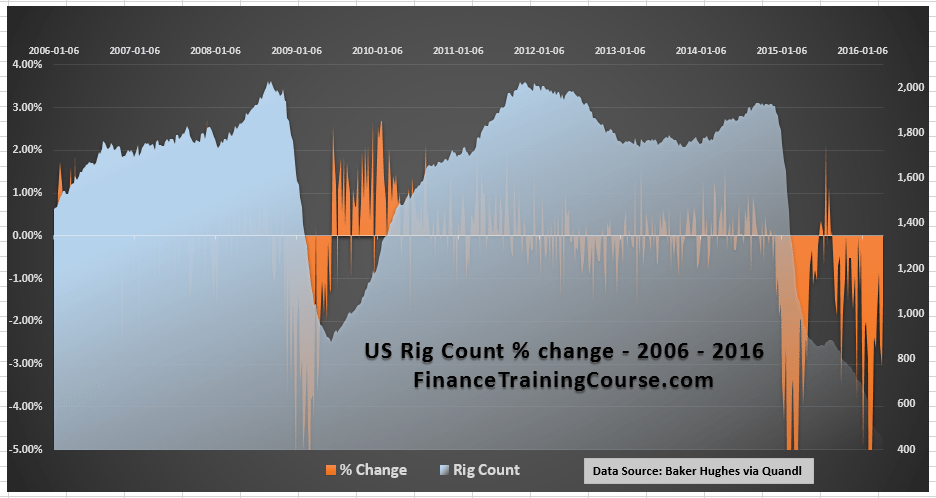
A 76% (roughly calculated) drop in rig count over a 15 month period leads to a production drop of 15% from the peak and an even lower number when calculated for the entire period.
There are many reasons for this paradox. Marginally profitable rigs are the first to go. There is no single break even cost of shale oil and it varies based on a range of factors. At the low end our rigs breaking even at oil price at sub $30. At the high end at US$ 111. The drop in prices has increased the focus of the industry on productivity and efficiency and the shakeup in the industry has eased up prices for equipment, drilling, man power and consumables. This leads to lower break even, higher quality rigs being deployed at a lower capital cost compared to a year earlier, pushing volume pumped per rig and rig profitability higher.
The argument then leads to an interesting sedge way. The competitive pressure unleashed by the decline in oil prices has made the surviving players significantly more competitive by creating a powerful incentive (survival) to improve efficiency. The break even point for shale oil is no longer at US$ 70. It has dropped significantly lower. Which implies that the drop in rig count and the loss of production is a temporary phenomenon. Temporary in a longer term sense. Even after factoring decline rates, production levels will stabilize at a threshold were reduction in production would get offset by productivity gains and new wells. As the industry learns to extract the most out of a given rig and inefficient wells are phased out, we are likely to see lower break even and higher volumes produced per rig.
We just wanted to run a crude (forgive the pun) analysis on raw figures to illustrate this point. We realize that the data set we have includes gas rigs so the image we are going to show next is not accurate or correct but the underlying trend is indicative of the picture we want to show you.
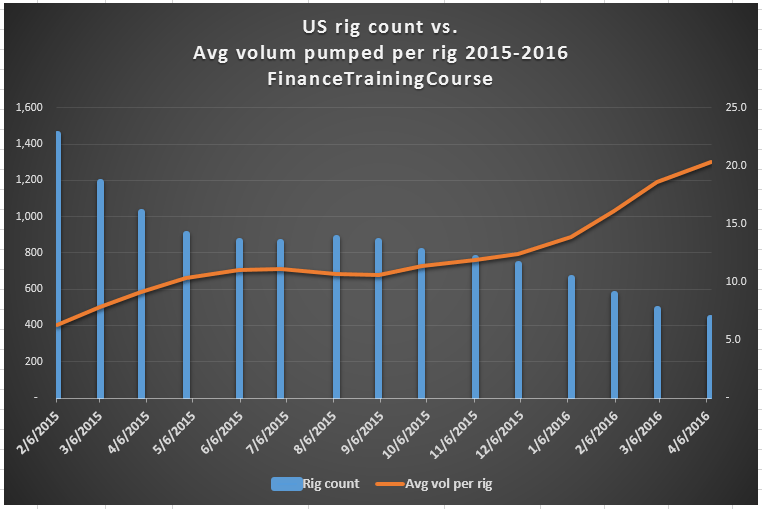
In the fifteen months since January 2015 as the collapse in rig count has taken hold, industry productivity measured by average volume pumped per rig has jumped up by three times. At least based on the figures above. Shale players over time and under pressure have figured out how to get three times the volume out of the same infrastructure. This is the point that the Forbes article makes above.
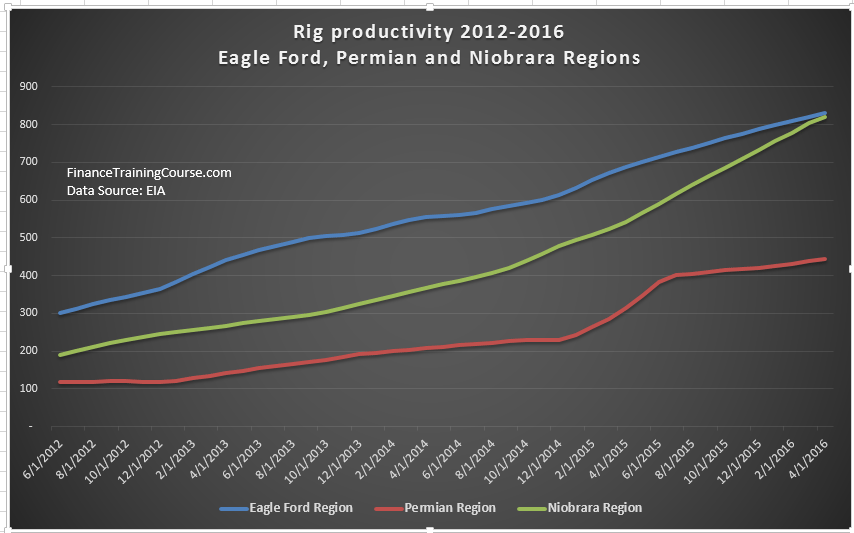
Update: Last night after writing the above lines, I went looking for data. EIA actually has rig productivity data for both oil and gas rigs by region. While it doesn’t show the same pick up in productivity that our crude graph shows above it supports the analysis shared earlier by other writers. Larger, more productive fields are pumping more oil per rig and the productivity has roughly tripled from 2011 levels. While capital investment is needed to replace the naturally decline in production with time, the productivity boost is ultimately going to give Middle Eastern oil producers a run for their money.
Art Berman, makes a powerful counter argument against this thinking. He questions the methodology and the basis behind the EIA rig productivity data set and warns the true measure of rig profitability are free cash flows, not barrels of oil pumped. Euan Mearns at Energy matters reviews decline rates and rig productivity to reach the same conclusion – that the much anticipated significant decline in US oil production is not likely in the near future.
So next Friday when the rig count number comes in, remember, it is only an indicator of reallocation of capital, not US crude oil production or a vindication of Saudi oil strategy. Just that, falling rig counts or rising rig productivity need to be read in with the correct context. Don’t take the headlines at face value.
In their well planned out rush to decimate shale players using brute force algorithms of a supply side glut, the Saudis have unintentionally created a monster. A competitor that has survived and in learning to ride the glut has only grown stronger with far superior productivity. The marginal players have not only survived, they are likely to rewrite the rules of the game as prices adjust to the new equilibrium. This realignment has important implications. As prices rise and access to capital is restored for rig operators, we are likely to see a second wave of shale production driven by the lessons learnt in the current cycle.
A second wave that will create additional downward price pressures on crude oil prices.