With maturity with option trading and risk management comes awareness that volatility is neither one dimensional nor constant. The challenge is that without access to trading tools most individual never get a chance to view volatility as a surface. The volatility surface modeling course is a collection of posts based on an upcoming title “Option Greeks Primer” being published by Palgrave Macmillan. It uses a step by step walk through of volatility surface modeling starting with raw implied volatility data and finishing with a completed surface in EXCEL.
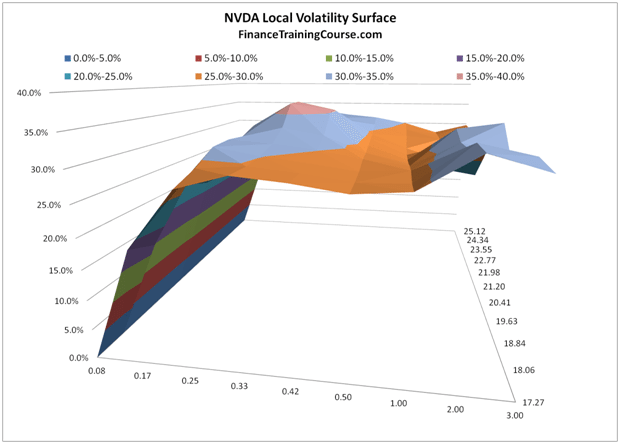
A volatility surface plots market consistent volatilities across moneyness (strike prices) and maturity (time to expiry). Within the surface market consistent volatilities are referred to as local volatilities. Rather than backing out volatility by applying the Black Scholes model in reverse to at the money options, local volatilities use implied volatilities and a one factor Black Scholes model to drive local volatility values across the surface.
Volatility surfaces, like Option Greeks, are among the last topics that get covered in a graduate level course on option pricing. Most schools and professors give it a wide berth in undergraduate and graduate level courses since it is based on an advance practitioner level understanding of the subject. To be fair once products, pricing and Greeks are covered most graduates program run out of time and runway.
If you are familiar with Black Scholes equation and pricing models used for pricing European options, calibrating volatility surfaces is one of the tweaks market practitioners use to side step the constant volatility assumption.
The volatility surface modeling course consists of 5 Lessons:
- Lesson 1 – Volatility surfaces, implied volatilities, smiles and skews
- Lesson 2 – Volatility surface, deep out of the money options and lottery tickets.
- Lesson 3 – The difference between implied and local volatility – volatility surfaces
- Lesson 4 – Creating the volatility surface dataset using implied volatilities
- Lesson 5 – Implied and Local Volatility Surfaces in Excel – Final steps