A guide to setting Stop Loss Limits.
One of the biggest advantages of working as a risk consultant and risk advisor is that you get to see a lot of dirty laundry. By working with client across the world you get a sense of what works and what doesn’t, especially in financial markets. If you are lucky sometimes you get to see stuff that had worked for years, stop working.
While implementing risk management solutions confusion is common at the implementation (translation) level. Theoretical models suggest a direction but market data and practicality recommends another. If a risk consultant doesn’t come from trading background or is not exposed to risk practices and ends up working with a client who is just as unfamiliar, together they can do a lot of damage. Given the inherent tension in the relationship between front office (traders) and middle office (risk managers) team, it is also common to end up with a bipolar schizophrenic relationship within the investment management function. It just multiplies the communication risk by an order of magnitude.
The biggest damage I have seen in my two decades in the field occurred on account of incorrect stop loss limits and misinterpretation of what the stop loss process was supposed to accomplish. It led to a well capitalized and respected financial institution relegated to the side lines of financial markets from a position of strength and leadership. The tragedy didn’t lie in their fall from grace. It lay in their continued reliance on incompetent advisers, misconceptions and bad advice.
Stop Loss limits example & case study – Context and background
You run a proprietary commodity trading desk for a large un-named investment bank in London. As part of your risk audit, your stop loss limits are being reviewed to judge their effectiveness. The three commodities your group deals with on a daily basis are WTI Crude Oil, Gold and Silver. You have been tasked to identify stop loss limits for the desk for both long and short positions in the three commodities as well as justify the level and thresholds based on a review of historical data. You have also been asked to identify market based triggers that should lead to an immediate review of stop loss limits based on changes in market conditions.
Here is what we plan to do in this and the next few posts.
- Walk through the process of setting up Stop Loss limits for the three commodities (Oil, Gold, Silver).
- Identify triggers for reviewing Stop Loss Limits.
- Evaluate (back test) Stop Loss limits based on market data.
- Evaluate the impact of correlations on portfolio risk limits.
If you are not familiar with Value at Risk, Histograms, Volatility and Correlation you may want to see the Calculating Value at Risk guide before moving ahead.
Stop Loss limits example and case Study – Data Requirements
What do we need to ensure that the Stop Loss limits set by us will keep us safe. If the limits fail what is the magnitude of failure we are likely to see? What data do we need to answer these question?
The data we need includes:
- Histogram of prices for the three commodities. We will use these histograms to identify likely as well as extreme price movements for the commodities under consideration.
- A distribution of volatility for the three commodities. We will use the distribution to stress test our stop loss limits as well as our estimates of max or worst case loss.
- Amount of capital that can be risked by a trader on a trade or a position in a given day.
- Amount of total risk capital allocated to the proprietary trading desk.
(For value at risk, volatility, correlations, histograms, portfolio optimization and related risk topics please see the Advance Risk Management Workshop)
Setting Stop Loss limits. First pass.
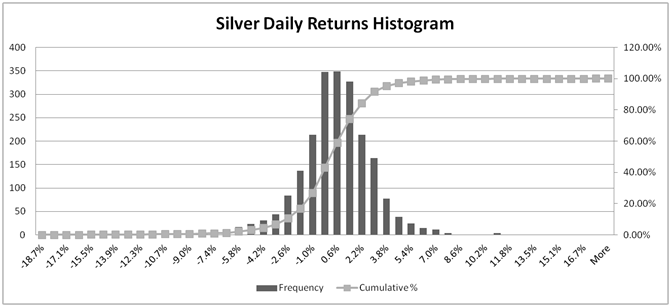
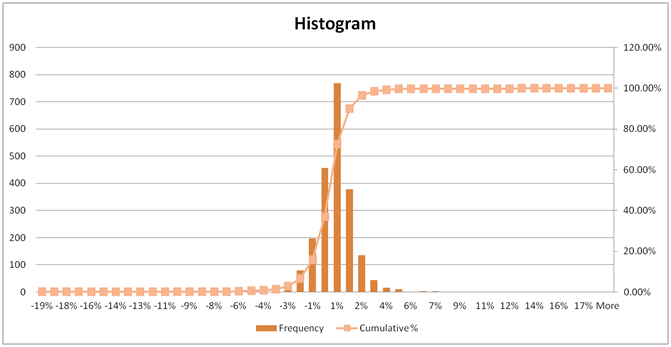
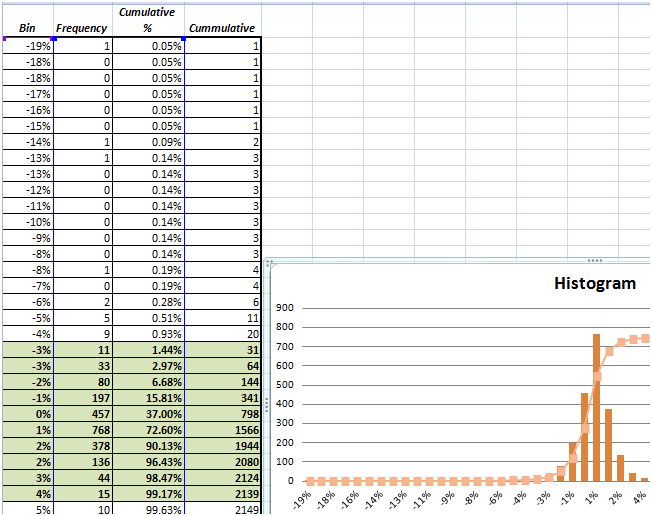
We start first with the histogram for the three commodities (Oil, Silver and Gold, in that order). The three histograms give us a range of worst case max losses on a given trading day using just under 8 years of data (2157 observations). For Gold and Silver the range of daily returns is between -19% to +17%. Whereas for Oil the range of daily returns is between -13% to 15.1%.
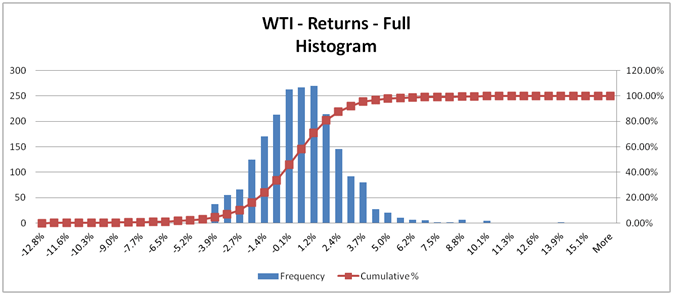
However what we are really interested in is the central part of the three distributions, the so called stop loss zones.
While we will come back to extreme values later, for now our primary interest is in the range of likely losses, losses we are likely to see on a daily or at worst once in every three to four days. We term this the every other day loss.
Remember the idea behind stop loss is capital conservation. The minute we hit a threshold of losses we want to cut our position and retreat. Where should this threshold be is the question we are trying to answer. Ideally we would like to set the threshold not at the end of this range but somewhere in the middle.
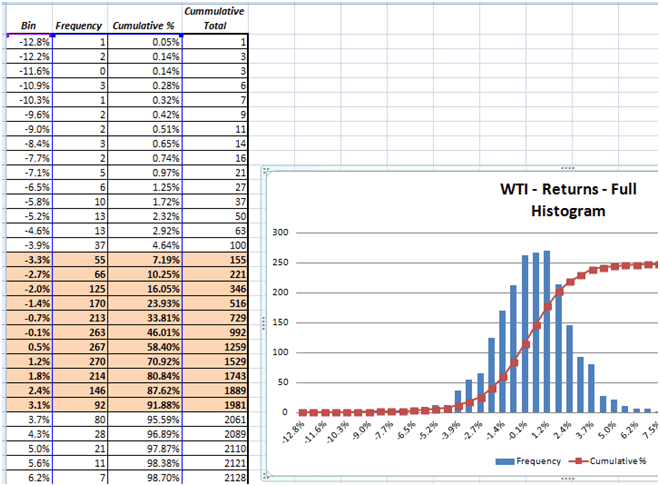
To pick our values we look at the cumulative probability distribution percentage. These numbers are given
in column 3 above. We start off with the numbers between 24% and 71% which together represent about 47% of the cumulative probability distribution shared in the highlighted portion of the graph above. The ranges of gains and losses is between -1.4% and +1.2%.
We trim it further to a loss of 0.7% and a gain of 1.2% for crude oil prices. Why and how? A 33.8% percentile rank in the above distribution corresponds to a one in 9 (or a 1 in 10 depending on if you round up or round down) trading day loss. There are a total of 2157 observation of which 213 fell in the range between -1.4% and -0.7% on one end and between -0.7% and -0.1% (both ends excluded). Our soft stop loss limit is set at -0.7% with a hard limit set at -1.4%. The soft limit triggers a sale and a reduction in exposure. The hard limits results in an immediate unwind of the position.
The reason why we picked this range is that for oil we want our traders to have the flexibility to run the position for a few days. If oil is at 90 dollars a barrel, a 1% or 1.5% move (loss) would read to a 1.35 dollar loss per barrel, a threshold we are likely to hit within a week, but not within intra-day trades.
The every other day loss sets two thresholds for us.
The stop loss limit has to be set higher than the every other day loss limit. A long position in oil is likely to touch a 0.7% loss every week or at best every alternate week. Similarly a short position is going to experience a positive jump of 1.2% at best every alternate week. The (0.7%) – 1.2% range is the amount that we will drop when our limit is hit and the position is sold if we decide to trade oil and strictly follow our stop loss limits.
It also represents how the market slices value and prices on a weekly basis and how fine our own stop loss grid needs to be. Which also means that your allocated trade capital per trade in oil also has to weigh in at higher than 1.2% per week per trade. Any lower and you will get wiped out much more sooner sometimes even with a single trade.
So for crude oil giving traders the ability to run a position for a week requires a stop loss capital allocation of 1.5% of notional under normal (average) market conditions. The stop loss capital requirement is different from market risk capital requirement which based on the above data may be as high as 8% – 14% of notional exposure.
If you want to run a tighter ship and only approve positions to run for intraday, the stop loss limit is going to be even more tighter (small band and range). If you approve positions to be run for a month, you would be work with wider limits (longer band and ranges).
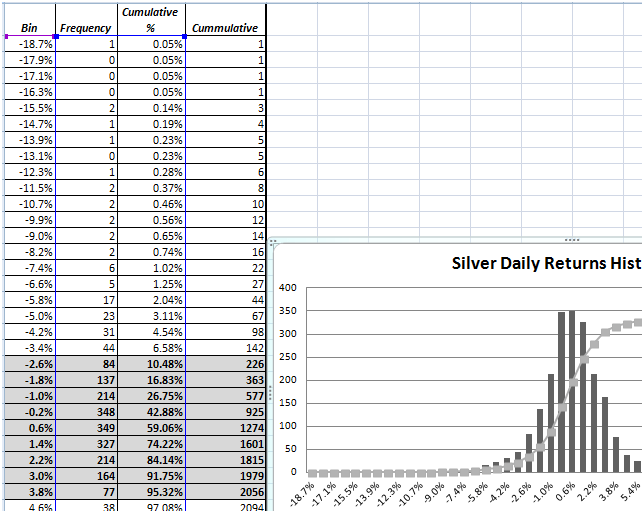
The every other day loss figure for Silver is slightly different at -1% to +1.4%. Compared to oil you can clearly see that the distribution is much more compact and compressed when it comes to probabilities but the tales and extreme value ranges are wider. In a later post when we compare volatility distributions you will see another related driver for stop loss limits.
For Gold the same ratio it comes in at -1% to .7%.
Once again the idea is to set a stop loss limit based on the number of days you want your traders to run a position and the shape and form of the underlying price distribution. You don’t want the traders to get hit by limit breaches and be required to approve extensions or exceptions to the limit every day but you also don’t want them to risk more capital than you can afford to burn. The final threshold you pick depends on the amount of capital you want to risk per trade/trader and the rate at which that capital will be consumed by market price and trade related losses.
In our next post we will take a look at how stop loss limits can be tested and what are possible market based triggers that should be used to initiate a review of stop loss limits.
Related posts
What is Risk? What is Risk Management?