Trailing volatility or Volatility Trend Analysis
Trailing Volatility or volatility Trend Analysis is the analysis of volatility trend lines. Volatility tends to behave in cycles. Rising volatility ultimately leads to a reversal and vice versa.
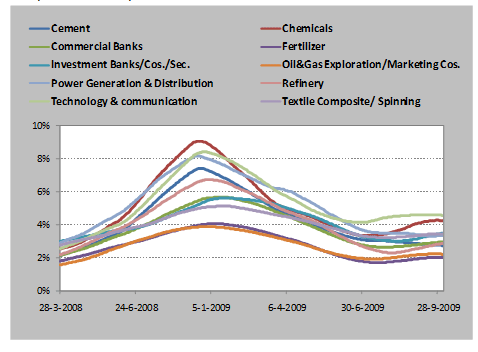
The volatility trend line is a graphical representation of the riskiness of a given instrument over time. It depicts the general trend witnessed in risk levels. A rising trend indicates an increase in risk due to increased fluctuations in underlying prices (level and/or frequency) over the period of study. A horizontal trend line indicates that average volatility has remained stable over the period whereas a declining trend line shows decreasing levels of risk.
The analysis may be carried for varying granularity. For example withiin the equity market we may analyze riskiness by sector:
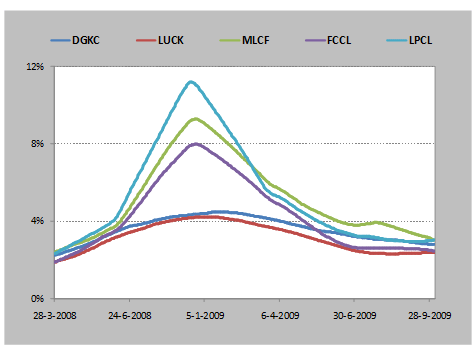
Or we may look at trend lines for stocks within a particular sector, such as the cement sector below:
A given point on the graph represents the average of the next sixty volatilities at that particular date. For example average volatility on 5-Jan-09 represents the average of the next sixty volatilities from this date where individual volatilities are calculated using the past sixty returns available.
The detailed step-by-step process for constructing a volatility trend line is given below:
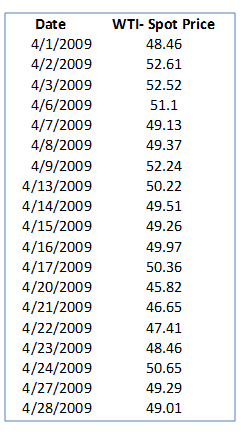
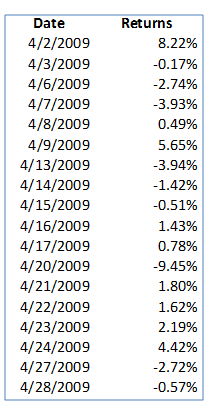
Step 1: Obtain the price time series for the given instrument being analyzed. We have spot price data for WTI Crude for 2 years from 1st April 2009 to 29th March 2011. A sample subset of the data is given below:
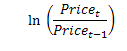
Step 2: Calculate the daily return time series from the price data. The daily returns are calculated by taking the natural logarithm of the ratio of successive (consecutive) prices:
A sample snapshot of the resulting return series is given below:
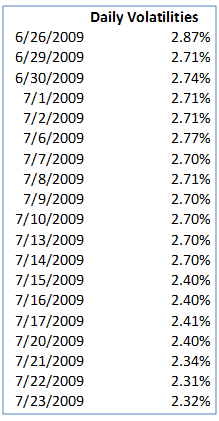
Step 3: Calculate the daily volatilities for sixty return observation windows, rolling forward by a day so that you get a series of 60-return daily volatilities. These volatilities are calculated using EXCEL’s STDEV() function applied to 60-return observations. The methodology for using this function is given in our earlier post:
Market Risk Metrics- Sharpe and Treynor Ratios
A sample snapshot of the daily volatility series obtain is given below:
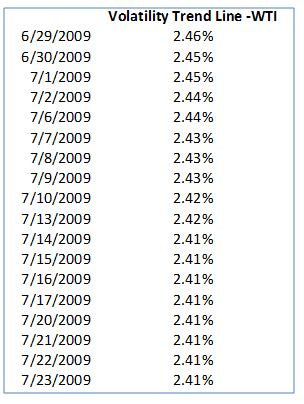
Step 4: Finally, calculate a moving or rolling average of 60 daily volatilities, rolling forward one day at a time to derive a series of average daily volatilities. This series is the volatility trend line. A sample snapshot of the 60-daily volatility rolling average series is given below:
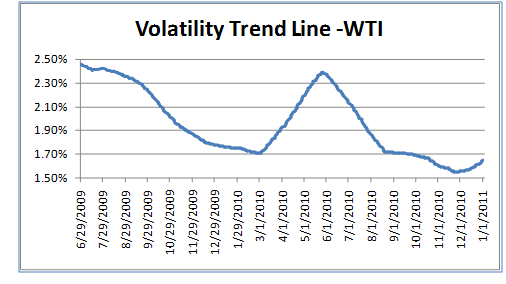
The resulting volatility trend line for WTI crude oil spot prices is given below:
The methodology for constructing a line graph in EXCEL is discussed in our post:
Correlation –Time series data graphs – prices & more
As mentioned earlier a data point on the volatility trend line series or graph represents the average of the next sixty daily volatilities at that particular date where each daily volatility figure is calculated using the past sixty returns available. From the graph above, we can see that the volatility or riskiness associated with WTI crude oil prices have decreased considerably as compared to levels seen in mid-2010.
Nice work. I believe we need mnegianful data like this out of which we could draw relationships. I haven’t taken a look at the RISK review, but just by the gut feeling about what you might have cooked up here, I recognize that this is a step in the right direction, because I have taken similar dive, although on a limited scale, in a different end of the pool (I have a smirk on my face right now, seeing someone else is beginning to connect the dots as well). But I believe the floor that we hit at the bottom will be the same, checked out oilinsights.net as well ;-)As an economy, we are addicted to fossil based fuels, including oil and its derivatives, natural gas, and interestingly coal for electricity and power, but as you have rightly pointed out as well, the story doesn’t end here.