Pitching commodity trading ideas to customers
Price volatility in crude oil, gold, silver, cotton, sugarcane, wheat and cereals has created an unprecedented opportunity for corporate relationship managers to cross sell treasury products to their institutional, trading, manufacturing and high net worth customers.
We present below a framework for empowering client facing treasury teams to go out and cross sell high value, high margin trading concepts to clients by educating customers about their exposures and some of the solutions available to reduce the risk associated with the same exposures.
There are 5 core themes to our discussion when it comes to commodity trading and trading ideas.
- Price
- Risk
- Value
- Products
- Limits
When engaging customers in discussions involving trading products and concepts, discussions generally revolve around one of the above themes. As a relationship or account manager if we are prepared to provide our recommendations based on a framework around one or more of these themes, the likelihood of the client understanding and buying the trade is higher. The framework is also useful in presenting analysis in a format that is logical and can be easily explained and digested.
The objective for using a framework is to work with clients across a range of product ideas and commodity markets. As long as there is broad agreement on the framework, the same trades can be applied across different markets.
Let’s take a look at each of these themes by one by one.
Price and Volatility
The difference between experienced and amateur traders is how we look at price.
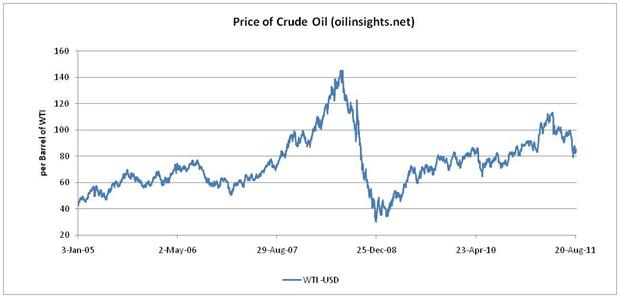
When I see a price graph (as an amateur trader) such as the one below for crude oil (WTI) prices from January 2005 to August 2011 my immediate assessment is based on a one dimensional view of prices. Price are high or low, relatively high or low, abnormally high or low. The dimension is price level. In mathematical terms we try and approximate single dimensions such as price using linear relationships.
But experienced traders look at price in more than one dimension. Rather than just looking at relative price levels they ask question about fundamental drivers of price as well as additional dimensions other than just price levels.
For instance if the product that you are selling to a client is a derivative structure, rather than absolute price levels, you are primary interest is in volatility. Volatility is our old friend from our first course in statistics, a concept we know by its more familiar name of standard deviation. Dispersion, volatility, vol, standard deviations are different names for the same phenomenon – how much is a series likely to move or deviate from its average or mean.
What is volatility?
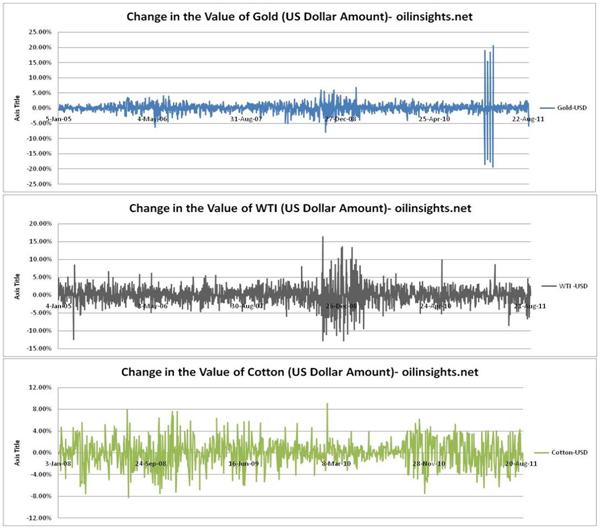
The collage above shows the daily relative price movement in percentage terms for three commodities – an ounce of gold, crude oil (WTI) and cotton. We simply run the excel standard deviation function on this price series to estimate volatility or standard deviation over the period in question.
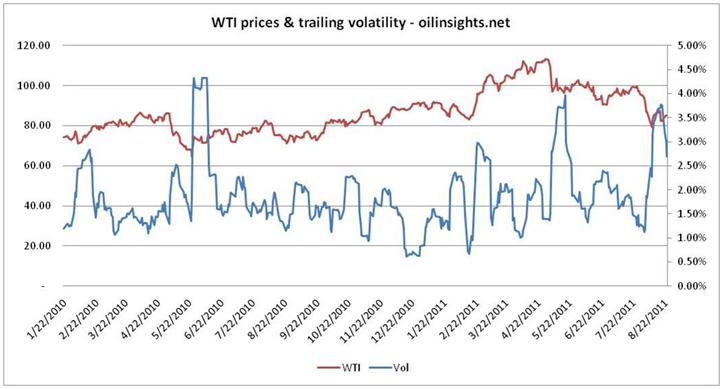
Once again rather than looking at a static estimate of volatility we are more interested in how volatility changes or behaves over time. The tool used here is trailing volatility (see graph below) a moving average of sorts for volatility that tracks how short term average price volatility changes from one day to the next. From a trading point of view this is important because our behavioral models indicate that for a one dimensional price based portfolio higher levels of volatility are toxic (more on this later). The computational finance term for this behavior is also known as volatility drag.
But you can use this toxicity to your advantage by one relationship that we will keep on coming back to: how options and volatility are related? and how changing levels of volatility impact different option prices?
So as an experienced trader rather than look at just price levels we want to look at how underlying volatility (in this trailing volatility) behaves over time with price levels. When dealing with options we want to buy options when volatility is low and sell them when volatility is high.
But volatility doesn’t just drive price assessment. It also has a strong relationship with various risk measures as well as calibrating our price and forecast models with market data. Conventional wisdom uses variations of tools based around volatility to estimate your worst case losses if markets decide to move against you and use limits and controls to cap the maximum amount you can lose when that happens. When customers take decision on hedging their exposures, estimating their exposures or defining their risk appetite, volatility is a primary input in that process.
A combination of measurement tools (such as vol), estimates (worst case loss), limits (the maximum worst case loss for a position, trade or portfolio), process (daily or end of day reporting) and controls (exception handling and booking losses) becomes the basis for risk systems.
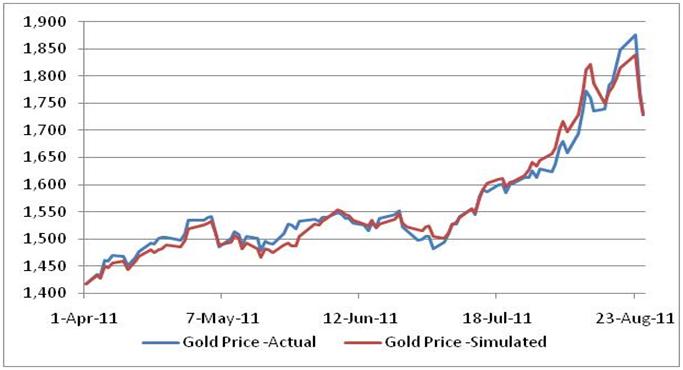
The challenge however is the backward looking view volatility provides. As you can see below while I can fit any historical price series with a model that tracks prices accurately, there is no guarantee that the model will hold for tomorrow’s price.
What is fair or relative value?
What is the right price for an ounce of gold? Now? Tomorrow? Six months from now? If you could answer this question correctly could you retire for life?
While it may be difficult to reconcile opinions about the fair price of gold there are tools and hints that we can use to determine if the price of gold relatively speaking expensive or cheap. If we feel the price is expensive it is great time to exit our positions and book our profits, if we feel it is cheap, it is a great time to add to our positions and wait for it to rise again.
One such tool is relative value. Relative value looks at other commodities and prices them in units of gold to get a better feel for what would be the right price level for any commodity. The tool is not just limited to analyzing the price of gold but can be easily extended for any other volatile commodity.
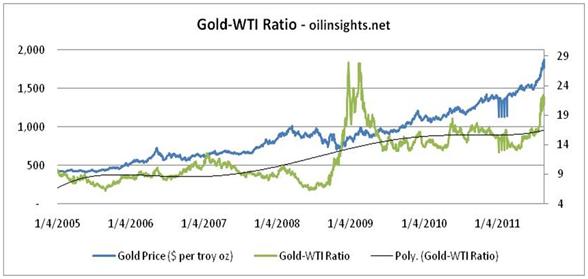
Linking Crude Oil (WTI) and Gold prices with the Gold-WTI ratio
For instance the graph below shows the Gold-WTI ratio, the number of barrels of crude oil an ounce of gold can buy (or has bought) over the last 6 years starting January 2005 and ending August 2011. The upward sloping blue line traces the price path of an ounce of gold; the green line tracks the Gold-WTI ratio; the thin black line is the polynomial curve fit to the Gold-WTI ratio over the last six years of observable data. As you can see the historical trend for the Gold-WTI ratio for three years stayed at about 9 barrels per ounce of gold and then jumped in 2009 and for the last two years has stayed at about 16 – 17 barrels of oil per ounce of gold. Which one of these is right, which one of these is stable, more importantly how do you which commodity to trust? What do other commodities such as silver and wheat and cotton have to say about the relative value of Gold.
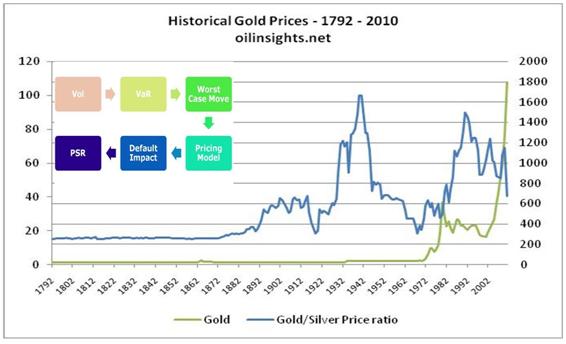
Which begs the next question, how long term is long term? Are fifty years of price enough and sufficient? How about 200 hundred years? More importantly what does that tell us about the price of gold?
What is Risk? A quick and dirty introduction to Pre-settlement risk limits.
As a relationship manager we have to balance two points of views. What is the client’s exposure? What is his worst case loss without any intervention? A hedging or trading conversation cannot move forward unless this question is answered. How do these numbers change with intervention (ideally with the solution we have or are suggesting)? What happens to our balance sheet exposure if we help the client with these solutions? What happens if the client defaults and is not able to settle the exposure he has taken on with our products and solutions? To the client? To us?
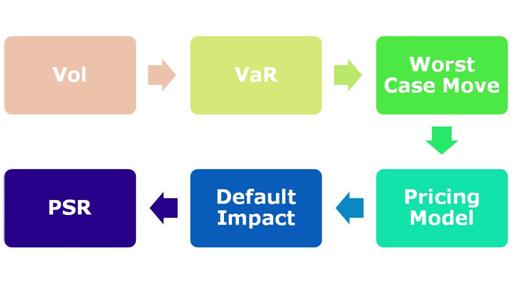
The Pre-settlement risk limit estimates the above numbers by following a simple process. Using volatility it estimates the worst case possible price move (value at risk or var) and then estimates the value of the solution to the client and the bank at that level. It then evaluates the impact of a default if the client is unable to fulfill his commitment. Vol è VaR è Default Impact è PSR limit exposure
From a risk point of view sometimes PSR can be a great tool to evaluate suitability of products and solutions in scenarios where client have been booked a series of losing trades. At times to manage trading losses, clients may book products that generate short term income but leads to a spike in PSR limit utilization. A PSR spike combined with trading losses is generally a great indicator of troubled waters ahead.
Commodity Trading Product Models
But you can’t answer any of the above questions if you don’t know the product set or can’t evaluate how the same products would behave under different market price conditions and scenarios. So we now need to build a simple accessible model that allows us to track and present the potential payoff or loss from each of our suggested strategies under at least a handful of scenarios.
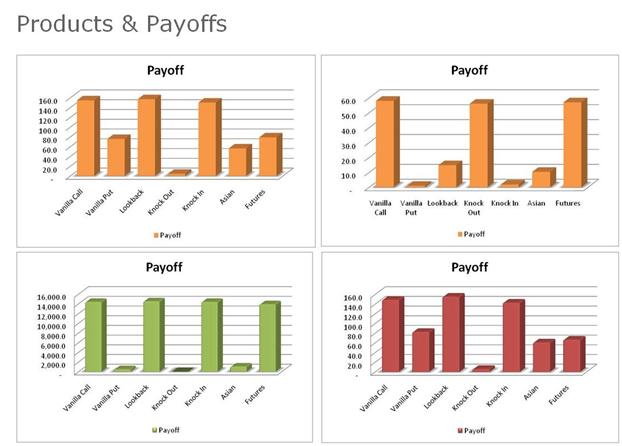
This also helps with client suitability and disclosure requirements and may be the saving grace that will save you from a long, painful and contentious professional liability court case if the transaction you have suggested to the client goes south.
This completes our brief review of our commodities trading framework that combines price, risk, value, products and limits to create newer and profitable opportunities for cross selling treasury products to corporate, institutional and high net worth clients.
The Treasury Products Training Workshop
By the end of the two day workshop participants will be able to:
a) Appreciate the linkage between commodity markets (precious metals, crude oil), currencies and rates
b) Trace the impact of monetary policy announcements on commodity markets
c) Explain trading strategies using futures, options and exotic products
d) Understand trading triggers
Target audience includes treasury relationship managers, account managers, risk professionals, senior leadership teams as well high value clients and customers. Our two day format takes a detailed look at the five elements we have touched and can be customized based on the profile of the audience.
- Price
- Risk
- Value
- Products
- Limits
Please feel free to drop us a line at [email protected] or [email protected] to get a customized proposal for your training needs.
Comments are closed.