Day Three updates
During our Day Two discussion at the Financial Risk Management Course we introduced the Aviation or Jet Fuel Hedging case study. One of the questions that kept on coming up during our case discussion was the analysis performed on the sensitivity of profit margin, its relationship with changes in crude oil prices as well as aviation fuel prices and what did the VaR shock actually meant. Board members specifically asked for help in understanding how to interpret that data we had presented as well as an explanation of the process we had used to complete the analysis.
Day Three, therefore, was completely devoted to building a simulated shortfall method in the class.
Here is the sequence we followed for building our fuel hedging and margin simulation model.
- We started off with building a simple crude oil simulator using the tools described in our Monte Carlo Simulation course.
- Step two of creating linking the crude oil model with the gross revenue generation model of the airline.
- Step three created a simple growth and contraction model using levels of crude oil prices. Higher crude oil prices led to lower traffic volumes and revenues. Lower crude oil prices led to higher traffic and revenues.
- This was then hooked up with the airline P&L and the P&L was summarized to two line items. Gross Revenues and Profit Margin.
- The output was then translated into two output graphs that presented the results for both crude oil prices as well as the simulated profit margin of the airline without any hedging in place.
All of the above was done using the most simplistic assumptions to test the model building process as well as get immediate feedback from the board on the presentation format it was most comfortable with. It was felt that once the model and reporting formats were finalized there would be time available to replace the crude assumptions made in the prototype shortfall model with more realistic and sophisticated choices.
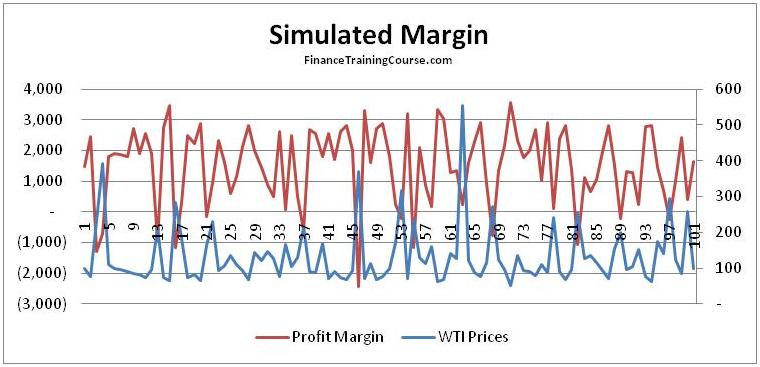
Both charts showed the same results but using different formats. The idea was to test readability and preference at the board level for a given presentation format for the fuel oil hedging case.

When summarized using a histogram the final simulated margin numbers were presented in the table below.

The cumulative probability of all scenarios where a margin shortfall occurred was 10.89%. This meant that using the model and the assumptions used in the simulation there was a 10.89% chance that the airline in question would face a scenario where its operating cash flows would turn negative and it would not be in a position to completely service its debt and other obligations in the absence of hedging.
A key assumption here was the high volatility world. We wanted to see the impact on the margin when crude oil volatility rose to historically high numbers. The high volatility world generated the following distribution of crude oil prices.

Which translated into the following distribution of Airline margins.

The high volatility assumption was further tested with a low volatility world view with the following results
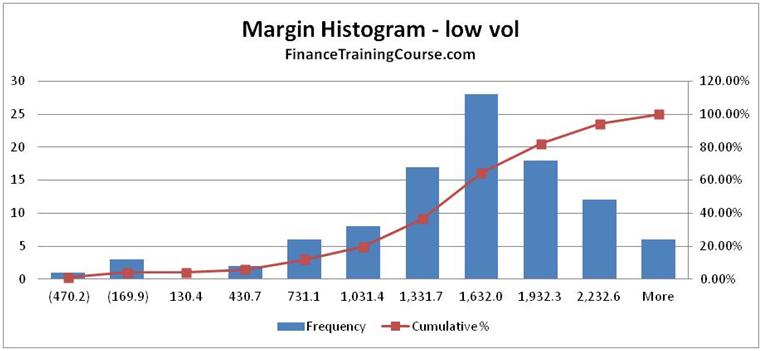
Which reduced to an immediate reduction in the probability of margin shortfall for 10.89% to just under 4%.

From a presentation point of view, the Board was now more comfortable with the analysis presented as well as the reporting template and format. In terms of target accounts a decision was made to use volatility and the probability of margin shortfall as the key drivers for determining the decision as well as the amount and the % of aviation fuel exposure that needed to be hedged.
Related items and developments in the risk and shortfall area
While discussing shortfall for the airline industry we also touched upon the concept of Expected Shortfall and the new debate within the banking regulation/ Basel II and Basel III sphere about replacing Value at Risk with Expected Shortfall.
Comments are closed.