We use a simple example to illustrate the calculation of Shadow Gamma as describe by Taleb in Dynamic Hedging.
Gamma is the second derivative of the change in the option price to a change in the underlying asset price. Alternatively, it is the rate of change in the option delta to a change in the underlying asset price.
Taleb’s approach for Gamma
Gamma may be calculated using the Black Scholes formula but according to Taleb, a more practical way of calculating Gamma is to calculate the actual change in the delta that arises when the price of the underlying is changed. Here delta is also taken to be the discrete change in the value of the option for a change in the value of underlying and not delta as determined from the Black Scholes formula.
For example, let us consider a 30-day out of money European call option on NVIDIA stock. From ivolatility.com we have obtained the following data for available options on 14-May-2014:
NVIDIA Out of Money European Call Options
| symbol | exchange | date | period | strike | out-of-the-money % | call/put | Iv | delta |
| NVDA | NASDAQ | 14-May-2014 | 30 | 18.1 | 0 | C | 0.27 | 0.49204 |
| NVDA | NASDAQ | 14-May-2014 | 30 | 19.005 | 5 | C | 0.2734 | 0.26021 |
| NVDA | NASDAQ | 14-May-2014 | 30 | 19.91 | 10 | C | 0.2987 | 0.13058 |
| NVDA | NASDAQ | 14-May-2014 | 30 | 20.815 | 15 | C | 0.301 | 0.0516 |
| NVDA | NASDAQ | 14-May-2014 | 30 | 21.72 | 20 | C | 0.301 | 0.01689 |
| NVDA | NASDAQ | 14-May-2014 | 30 | 22.625 | 25 | C | 0.301 | 0.00472 |
| NVDA | NASDAQ | 14-May-2014 | 30 | 23.53 | 30 | C | 0.301 | 0.00114 |
| NVDA | NASDAQ | 14-May-2014 | 30 | 24.435 | 35 | C | 0.301 | 0.00024 |
| NVDA | NASDAQ | 14-May-2014 | 30 | 25.34 | 40 | C | 0.301 | 0.00005 |
| NVDA | NASDAQ | 14-May-2014 | 30 | 26.245 | 45 | C | 0.301 | 0.00001 |
| NVDA | NASDAQ | 14-May-2014 | 30 | 27.15 | 50 | C | 0.301 | 0 |
| NVDA | NASDAQ | 14-May-2014 | 30 | 28.055 | 55 | C | 0.301 | 0 |
| NVDA | NASDAQ | 14-May-2014 | 30 | 28.96 | 60 | C | 0.2885 | 0 |
Let us consider the 60% 30-day out-of-money call option with strike of 28.96, spot price of 18.1 and annualized volatility of 28.85%. The risk free rate and dividend yield assumed in our calculations are 0.05% and 0% respectively. The value of the option works out to 0.000000003. Now let us assume that the underlying stock price changes to 22.1. The value of the option becomes 0.0003291. Hence an increase in the stock price led to a 0.00033 change in the value of the option, the delta. The following are deltas calculated for changes in the underlying asset price (with respect to the original spot price) for the given option:
Deltas
| NVIDIA Stock Price | Delta |
| 15.6 | (0.00000) |
| 16.1 | (0.00000) |
| 16.6 | (0.00000) |
| 17.1 | (0.00000) |
| 17.6 | (0.00000) |
| 18.1 | – |
| 18.6 | 0.00000 |
| 19.1 | 0.00000 |
| 19.6 | 0.00000 |
| 20.1 | 0.00000 |
| 20.6 | 0.00001 |
| 21.1 | 0.00003 |
| 21.6 | 0.00011 |
| 22.1 | 0.00033 |
| 22.6 | 0.00088 |
| 23.1 | 0.00218 |
| 23.6 | 0.00498 |
| 24.1 | 0.01058 |
| 24.6 | 0.02105 |
| 25.1 | 0.03935 |
| 25.6 | 0.06946 |
| 26.1 | 0.11624 |
| 26.6 | 0.18519 |
| 27.1 | 0.28201 |
| 27.6 | 0.41198 |
| 28.1 | 0.57942 |
| 28.6 | 0.78721 |
| 29.1 | 1.03647 |
| 29.6 | 1.32654 |
| 30.1 | 1.65513 |
| 30.6 | 2.01866 |
| 31.1 | 2.41271 |
| 31.6 | 2.83249 |
| 32.1 | 3.27323 |
| 32.6 | 3.73050 |
a. Up Gamma & Down Gamma
In this discrete measurement, gamma is calculated twice for each asset price. An up-gamma is the change in the value of delta, given the underlying asset price moves up by an incremental value; down gamma is the change in the value of the delta given that the underlying asset price moves down by an incremental value.
For example, the up-gamma calculated at asset price 25.1 for an increment of 1 unit in the asset price is equal to the delta calculated at asset price 26.1 less the delta calculated at asset price 25.1, i.e. up-gamma (25.1) = delta (26.1)-delta (25.1) = 0.11624 – 0.03935 = 0.0769.
In like manner, the down-gamma calculated at asset price 25.1 for a decrement of 1 unit in the asset price is equal to the delta calculated at asset price 25.1 less the delta calculated at asset price 24.1, i.e. down-gamma (25.1) = delta (25.1)-delta (24.1) = 0.03935 – 0.01058 = 0.0288.
The up-gamma and down-gamma changes in delta for a sample set of asset prices are given below:
NVIDIA Gammas by Stock Price
| NVIDIA Stock Price | Delta | Up-Gamma | Down-Gamma |
| 15.6 | (0.00000) | 0.0000 | 0.0000 |
| 16.1 | (0.00000) | 0.0000 | 0.0000 |
| 16.6 | (0.00000) | 0.0000 | 0.0000 |
| 17.1 | (0.00000) | 0.0000 | 0.0000 |
| 17.6 | (0.00000) | 0.0000 | 0.0000 |
| 18.1 | – | 0.0000 | 0.0000 |
| 18.6 | 0.00000 | 0.0000 | 0.0000 |
| 19.1 | 0.00000 | 0.0000 | 0.0000 |
| 19.6 | 0.00000 | 0.0000 | 0.0000 |
| 20.1 | 0.00000 | 0.0000 | 0.0000 |
| 20.6 | 0.00001 | 0.0001 | 0.0000 |
| 21.1 | 0.00003 | 0.0003 | 0.0000 |
| 21.6 | 0.00011 | 0.0008 | 0.0001 |
| 22.1 | 0.00033 | 0.0018 | 0.0003 |
| 22.6 | 0.00088 | 0.0041 | 0.0008 |
| 23.1 | 0.00218 | 0.0084 | 0.0018 |
| 23.6 | 0.00498 | 0.0161 | 0.0041 |
| 24.1 | 0.01058 | 0.0288 | 0.0084 |
| 24.6 | 0.02105 | 0.0484 | 0.0161 |
| 25.1 | 0.03935 | 0.0769 | 0.0288 |
| 25.6 | 0.06946 | 0.1157 | 0.0484 |
| 26.1 | 0.11624 | 0.1658 | 0.0769 |
| 26.6 | 0.18519 | 0.2268 | 0.1157 |
| 27.1 | 0.28201 | 0.2974 | 0.1658 |
| 27.6 | 0.41198 | 0.3752 | 0.2268 |
| 28.1 | 0.57942 | 0.4570 | 0.2974 |
| 28.6 | 0.78721 | 0.5393 | 0.3752 |
| 29.1 | 1.03647 | 0.6187 | 0.4570 |
| 29.6 | 1.32654 | 0.6921 | 0.5393 |
| 30.1 | 1.65513 | 0.7576 | 0.6187 |
| 30.6 | 2.01866 | 0.8138 | 0.6921 |
| 31.1 | 2.41271 | 0.8605 | 0.7576 |
| 31.6 | 2.83249 | 0.8980 | 0.8138 |
The difference between the up-gamma and down-gamma changes is depicted below:
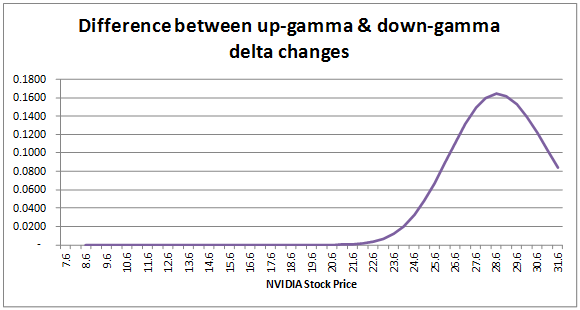
We can see that the difference does not remain constant as asset price changes. Hedging exactly for gamma fails to account for the fact that changes in delta are not consistent across asset prices changes.
Shadow gamma calculation example
The change in the delta is due to a change in the underlying asset price. A change in the asset price suggests a change in volatility (and possibly other price elements as well). However, the gamma calculation assumes that volatility remains unchanged. Therefore there needs to be an adjustment in the gamma measure that considers that the underlying asset price volatility has changed. Taleb suggests the calculation of the shadow gamma measure which adjusts the basic gamma measure by calculating the changes in delta taking into account volatility changes as well as price changes.
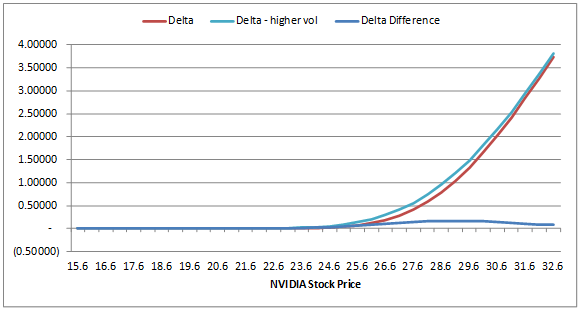
The revised delta measure used in the calculation of the shadow gamma is the difference between the value of the option considering both a price change and revised volatility level, and the original value of the option at the original spot and volatility level. In our example, we have increase volatility by 5% so that it is now 33.85%. The results for the revised delta are given below for a sample set of asset prices:
Revised Deltas
| NVIDIA Stock Price | Delta | Delta – higher vol | Delta Difference |
| 15.6 | (0.00000) | (0.0000) | 0.0000 |
| 16.1 | (0.00000) | (0.0000) | 0.0000 |
| 16.6 | (0.00000) | (0.0000) | 0.0000 |
| 17.1 | (0.00000) | 0.0000 | 0.0000 |
| 17.6 | (0.00000) | 0.0000 | 0.0000 |
| 18.1 | – | 0.0000 | 0.0000 |
| 18.6 | 0.00000 | 0.0000 | 0.0000 |
| 19.1 | 0.00000 | 0.0000 | 0.0000 |
| 19.6 | 0.00000 | 0.0000 | 0.0000 |
| 20.1 | 0.00000 | 0.0001 | 0.0000 |
| 20.6 | 0.00001 | 0.0001 | 0.0001 |
| 21.1 | 0.00003 | 0.0004 | 0.0004 |
| 21.6 | 0.00011 | 0.0009 | 0.0008 |
| 22.1 | 0.00033 | 0.0021 | 0.0018 |
| 22.6 | 0.00088 | 0.0045 | 0.0036 |
| 23.1 | 0.00218 | 0.0089 | 0.0067 |
| 23.6 | 0.00498 | 0.0168 | 0.0118 |
| 24.1 | 0.01058 | 0.0301 | 0.0195 |
| 24.6 | 0.02105 | 0.0513 | 0.0303 |
| 25.1 | 0.03935 | 0.0838 | 0.0444 |
| 25.6 | 0.06946 | 0.1312 | 0.0618 |
| 26.1 | 0.11624 | 0.1978 | 0.0816 |
| 26.6 | 0.18519 | 0.2877 | 0.1025 |
| 27.1 | 0.28201 | 0.4050 | 0.1230 |
| 27.6 | 0.41198 | 0.5531 | 0.1411 |
| 28.1 | 0.57942 | 0.7346 | 0.1552 |
| 28.6 | 0.78721 | 0.9512 | 0.1640 |
| 29.1 | 1.03647 | 1.2032 | 0.1667 |
| 29.6 | 1.32654 | 1.4901 | 0.1635 |
| 30.1 | 1.65513 | 1.8101 | 0.1549 |
| 30.6 | 2.01866 | 2.1608 | 0.1421 |
| 31.1 | 2.41271 | 2.5390 | 0.1263 |
| 31.6 | 2.83249 | 2.9416 | 0.1091 |
| 32.1 | 3.27323 | 3.3648 | 0.0916 |
| 32.6 | 3.73050 | 3.8054 | 0.0749 |
a. Shadow up-gamma & Shadow down-gamma
The shadow gamma is calculated as follows for a given stock price point, B, such that A<B<C where A is a stock price less than B and C is a stock price greater than B:
Shadow up –gamma (B) = (Delta (C, revised vol) – Delta (B, original vol))/(C-B), where underlying asset price is assumed to go up to C from B
Shadow down-gamma (B) = (Delta (B, original vol) – Delta (A, revised vol))/(B-A), where underlying asset price is assumed to go down to A from B
For example, the up-gamma calculated at asset price 25.1 for an increment of 1 unit in the asset price is equal to the delta using the revised volatility calculated at asset price 26.1 less the delta using the original volatility calculated at asset price 25.1, i.e. shadow up-gamma (25.1) = [delta_higher vol (26.1)-delta (25.1)]/(26.1-25.1) = 0.1978 – 0.03935 = 0.1585.
In like manner, the down-gamma calculated at asset price 25.1 for a decrement of 1 unit in the asset price is equal to the delta using the original volatility calculated at asset price 25.1 less the delta using the revised volatility calculated at asset price 24.1, i.e. down-gamma (25.1) = [delta (25.1)-delta_higher vol (24.1)]/(25.1-24.1) = 0.03935 –0.0301 = 0.0093.
The gammas and shadow gammas for a sample set of asset prices are given below:
Gammas & Shadow Gammmas
| NVIDIA Stock Price | Up-Gamma | Down-Gamma | Shadow up gamma | Shadow down gamma |
| 15.6 | 0.0000 | 0.0000 | 0.0000 | (0.0000) |
| 16.1 | 0.0000 | 0.0000 | 0.0000 | (0.0000) |
| 16.6 | 0.0000 | 0.0000 | 0.0000 | (0.0000) |
| 17.1 | 0.0000 | 0.0000 | 0.0000 | (0.0000) |
| 17.6 | 0.0000 | 0.0000 | 0.0000 | (0.0000) |
| 18.1 | 0.0000 | 0.0000 | 0.0000 | (0.0000) |
| 18.6 | 0.0000 | 0.0000 | 0.0000 | (0.0000) |
| 19.1 | 0.0000 | 0.0000 | 0.0001 | (0.0000) |
| 19.6 | 0.0000 | 0.0000 | 0.0001 | (0.0000) |
| 20.1 | 0.0000 | 0.0000 | 0.0004 | (0.0000) |
| 20.6 | 0.0001 | 0.0000 | 0.0009 | (0.0000) |
| 21.1 | 0.0003 | 0.0000 | 0.0021 | (0.0000) |
| 21.6 | 0.0008 | 0.0001 | 0.0043 | (0.0000) |
| 22.1 | 0.0018 | 0.0003 | 0.0086 | (0.0001) |
| 22.6 | 0.0041 | 0.0008 | 0.0159 | (0.0000) |
| 23.1 | 0.0084 | 0.0018 | 0.0279 | 0.0001 |
| 23.6 | 0.0161 | 0.0041 | 0.0463 | 0.0005 |
| 24.1 | 0.0288 | 0.0084 | 0.0732 | 0.0017 |
| 24.6 | 0.0484 | 0.0161 | 0.1102 | 0.0043 |
| 25.1 | 0.0769 | 0.0288 | 0.1585 | 0.0093 |
| 25.6 | 0.1157 | 0.0484 | 0.2183 | 0.0181 |
| 26.1 | 0.1658 | 0.0769 | 0.2888 | 0.0324 |
| 26.6 | 0.2268 | 0.1157 | 0.3679 | 0.0539 |
| 27.1 | 0.2974 | 0.1658 | 0.4526 | 0.0842 |
| 27.6 | 0.3752 | 0.2268 | 0.5392 | 0.1242 |
| 28.1 | 0.4570 | 0.2974 | 0.6238 | 0.1744 |
| 28.6 | 0.5393 | 0.3752 | 0.7029 | 0.2341 |
| 29.1 | 0.6187 | 0.4570 | 0.7736 | 0.3018 |
| 29.6 | 0.6921 | 0.5393 | 0.8342 | 0.3754 |
| 30.1 | 0.7576 | 0.6187 | 0.8839 | 0.4519 |
| 30.6 | 0.8138 | 0.6921 | 0.9229 | 0.5286 |
| 31.1 | 0.8605 | 0.7576 | 0.9521 | 0.6026 |
| 31.6 | 0.8980 | 0.8138 | 0.9729 | 0.6717 |
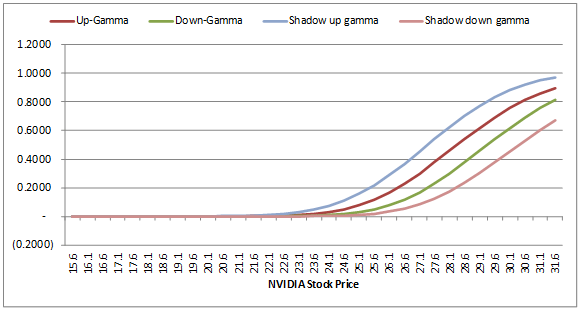
The up-gamma at a stock price of 28.6 forecasts a change in delta of 0.5393 if underlying price increases by 1. The shadow up-gamma however suggests that the forecast of the change in delta taking into account volatility is 0.9512. An exact gamma hedge that does not factor in volatility means that there could be a larger portion of the position that is un-hedged and exposed to risk than expected when volatility levels change.
References:
- “Dynamic Hedging – Managing Vanilla and Exotic Options” – Nassim Taleb, John Wiley & Sons, Inc. 1996