Econmic Capital Modeling – Using accounting data
With the arrival of fair value accounting, mark to market disclosures and Sarbanes Oxley (SOX) the quality of accounting data has improved over the last decade. It is not a perfect proxy for ground realities but it is represents the closest number we have to a credible, audited series. Accounting data also incorporates the net interaction between market, credit, operational, legal and interest rate risks. Hedged or un-hedged market and rate volatility results now flow through either P&L or Shareholders equity. If you use accounting data there is no need to build a complicated correlation model that factors in the relationship between business lines. Removing the correlation model simplifies the number of model parameters. That one factor by itself compensates for any perceived short comings of using accounting data.
The usage of accounting data in risk modeling is not new. We have a history of calibrating Value at Risk (VaR) models using trading P&L generated from accounting system. What is being proposed is extending that approach to the complete collection of business lines – not just treasury income. The approach is similar to using portfolio model results for a multi asset investment portfolio VaR calculation short circuiting the need to use a variance covariance matrix.
Accounting data is also easily understood by board members and senior management. There is no magical transformation, no exotic black boxes that need to be explained.
There are challenges. Accounting focus tends to be short term generally limited to one year. Economic capital by definition has to have a longer term outlook. Accounting approximations in the area of credit, loan loss reserves, collateral valuation and recoveries have estimation and mark to market issues that need to be addressed. After segregating income by business lines, we need an accounting capital allocation model by business line. Segregating P&L by business line is easy, segregating capital for the same lines on a month on month basis is a question mark. Having said that working around these issues is still easier than building a robust correlation models that cuts across business lines and risk types. The issues with smoke and mirror assumptions required to build such models have been increasing over the years to the point that most boards spend more time questioning and challenging assumptions than working with model results.
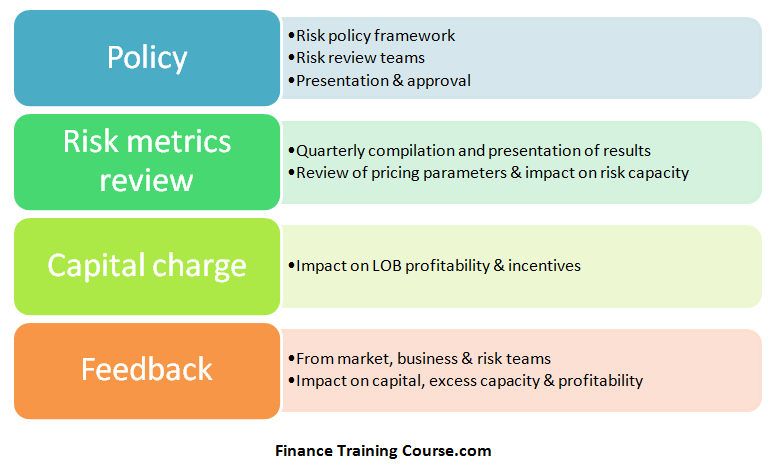
Despite its many challenges, the accounting stream is still our closest proxy to an audited proxy for information that can be used for building models, simply because it is better understood and accepted when it comes to policy, risk metrics, capital charge calculations and board presentations.
Economic Capital modeling – version 1.0
Here is a high level overview of what we want our model to do.
1) Use historical accounting data variations to estimate the probability of regulatory or market based intervention. Markets intervene when they taste blood in the water. A market intervention results in a stampede (run) to reduce exposure to the name in question. Regulators intervene when they feel a market intervention will create a domino effect and threaten the stability of financial systems. A market intervention follows the winner takes all, last in, first out approach. A regulatory intervention tries for an ordered shutdown, exit or takeover.
2) Uses Core regulatory ratios as input. While one cannot forecast the order in which interventions occur, the leading event is a name crisis. Analysts forecast the impact of the name crisis on core ratios and the speed with which rating agencies will degrade credit ratings and feed the crisis. Regulatory capital, capital adequacy, liquidity and leverage are four core ratios the model uses to track the probability of intervention.
3) Modeling paths. There are two modeling paths that can be followed. A P&L (net income) path that tracks the impact of historical P&L changes on common equity as well as capital adequacy, liquidity and leverage. An alternate shareholders equity path that tracks the impact of historical book equity changes on capital adequacy, liquidity and leverage. For the P&L path to work a history of large losses is necessary. Without such a history the model doesn’t work. The shareholders equity path has no such requirements.
4) Board involvement and presentation. The board sets target intervention probabilities – probabilities that represent acceptable risk of either event for the board. This is done by building a utility curve to show the board capital requirements for each intervention threshold on the curve against existing capital as well as suggested future capital levels.
5) Economic Capital. The amount of economic capital required is the point where the board picks a acceptable probability threshold for market intervention. This may not necessarily be minimum probability or maximum capital. The amount of required capital associated with the accepted probability is economic capital.
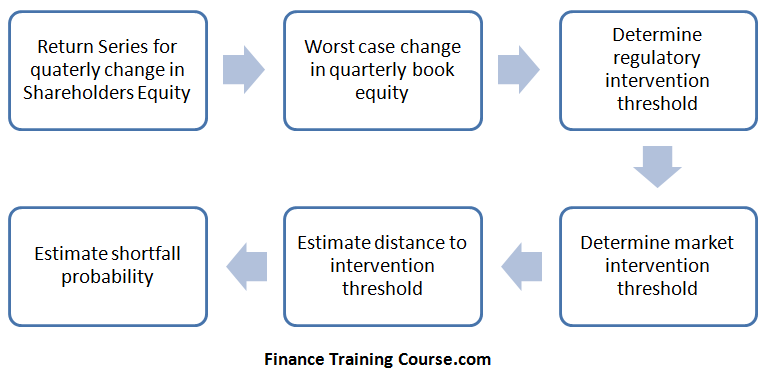
Regulatory capital model work with a value at risk tool using preset confidence level. The economic capital model uses a variation drawn from the same principal but a different family of models called shortfall models. It uses underlying volatility to determine distance to market or regulatory intervention event. Then converts that distance (measured in terms of volatility) to a probability estimate. The utility curve represents a plot of distances and probabilities that are used to calibrate and lock risk appetite of the board.
In conservative and tightly regulated environment where regulators lead the industry, Economic capital should ideally be less than required regulatory capital. In environments where regulators are still playing catch up with market forces and the industry leads regulators, economic capital will be more than regulatory capital requirement. One variation of regulatory arbitrage is searching for similar scenarios where regulators, tax payers and the national treasury bears the true price of risk.