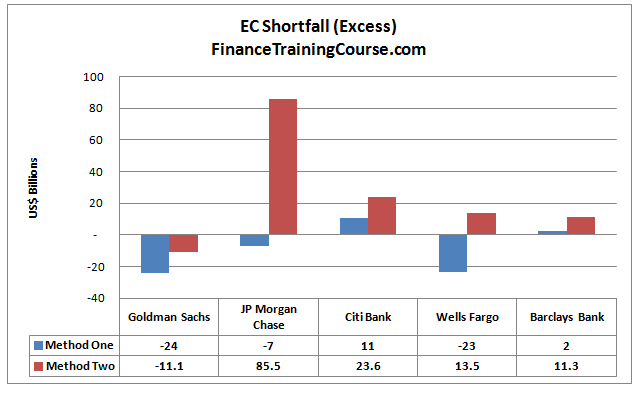
So far we have presented two methods for estimating Economic Capital. The first uses the worst case change in Shareholders equity, the second the volatility of the same changes.
The challenge with method one and two is that they use capital adequacy as the determining factor for estimating economic capital. Is capital adequacy a good measure of underlying financial risk? Are there better measures available? Within the risk and capital estimation world participants generally have issues with the responsiveness of capital adequacy ratio to market based changes. It is an interesting paradox given that the Basel regulatory framework is built around the capital adequacy measure.
Using a intervention trigger other than Capital Adequacy
Within North American regulators the preferred regulatory ratio is Leverage. There is a reason for their discomfort with Capital adequacy as the prime protector of the banking system. Shiela Bair the Chairperson of FDIC during the financial crisis makes her thoughts on this issue very clear.
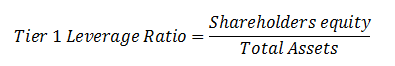
Tier 1 leverage ratio uses Tier 1 capital rather than the entire capital stock. Under the capital adequacy guidelines provided by FRB Regulations (Appendix D to Part 225—Capital Adequacy Guidelines for Bank Holding Companies: Tier 1 Leverage Measure), Tier 1 leverage ratio is calculated by dividing Tier 1 capital by the firm’s average total consolidated assets.
Leveraging capital requires a significant amount of monitoring within financial services. There is a fine line between too little and too much. The fine line lies between the risk of default or insolvency and inefficient utilization of capital. The problem is that bank runs and name crisis once triggered can kill a perfectly health bank by the exit pressure wave they create. While on paper a bank’s leverage ratio may be considered reasonable, once the market decides to turn and starts calling in to collect, leverage ratio can sink faster than a speeding bullet.
Bank’s that are of the highest standard under BOPEC (Bank subsidiaries, Other subsidiaries, Parent, Earnings, Capital) are required to main a tier 1 leverage of 3%. New regulation recently raised this to 5% for banks with assets over US$ 700 billion. Banks that have a significant impact on financial markets are encouraged to maintain a minimum leverage of 6%. Other banking institutions are required to maintain a tier 1 leverage ratio of 4%.
Given the way the leverage ratio is calculated, the higher the regulatory leverage ratio, the better.
Economic Capital estimates using leverage ratio
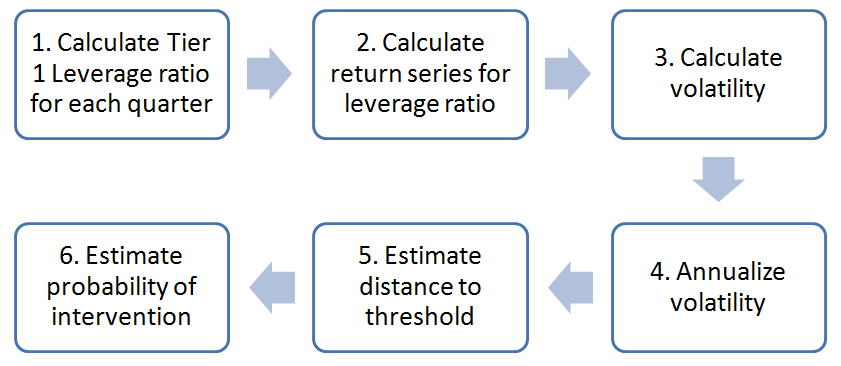
Method three follows the same process we have used earlier. We create a trail of leverage ratios starting 2002 and ending at 2014 for the 5 banks. Using the trail we calculate the quarterly shift in ratios for each banks in our sample. The shifts (return series) will be used to estimate volatility. Volatility will be used to estimate the probability that the ratio for a given bank in question will fall below the intervention threshold.
For the purpose of this note and the economic capital case study, We will use FBR Regulations. Because of the limitation of our public data, we will use the Shareholder’s Equity as a proxy for Tier 1 Capital for calculating Tier 1 Leverage Ratio.
The revised and simplified Tier 1 leverage ratio formula is:
Here is what the revised process looks like:
There are two ways of reviewing the trail of leverage ratios. The first is to calculate trailing leverage, a plot of leverage ratios from one quarter to the next. The second is to use the trail to plot of the histogram produced when we review the change in leverage ratio from one quarter to the next.
We look at both series. As per the regulatory guidelines discussed earlier in this note, large, influential US banks need to maintain their leverage ratio within a certain range. We see that regulation at work for 4 of the 5 banks in our sample. Barclays falls under UK guidelines that require a 4% threshold, less than half of that required of US domiciled banks.
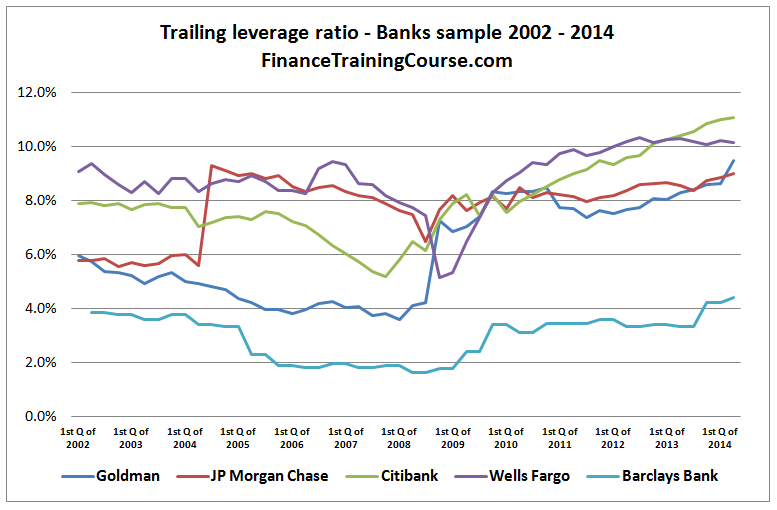
While the plot above give us an indication of where US banks have been when it comes to leverage ratio, it doesn’t really help in answering the “where they will be in the near future” question.
For that we need our distribution of quarter to quarter changes in the leverage ratio as well as the recorded volatility in that ratio over the last 12 years. Both set of graphs follows next for the 5 banks in our sample.
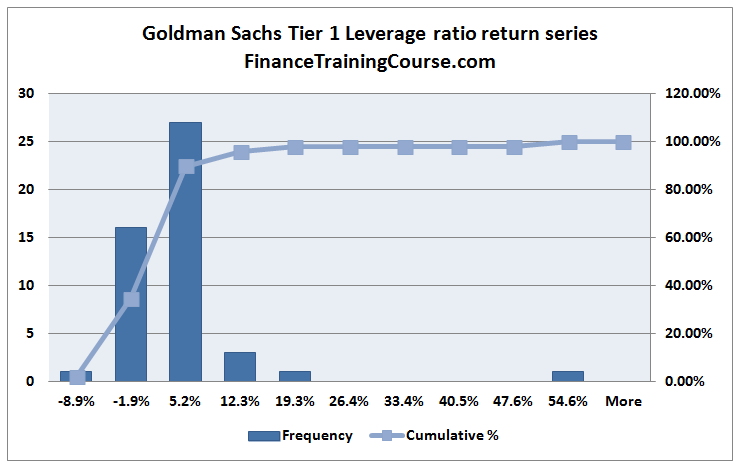

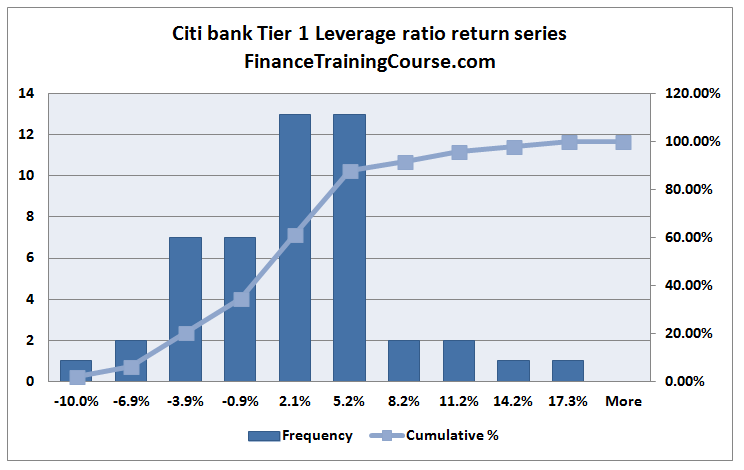
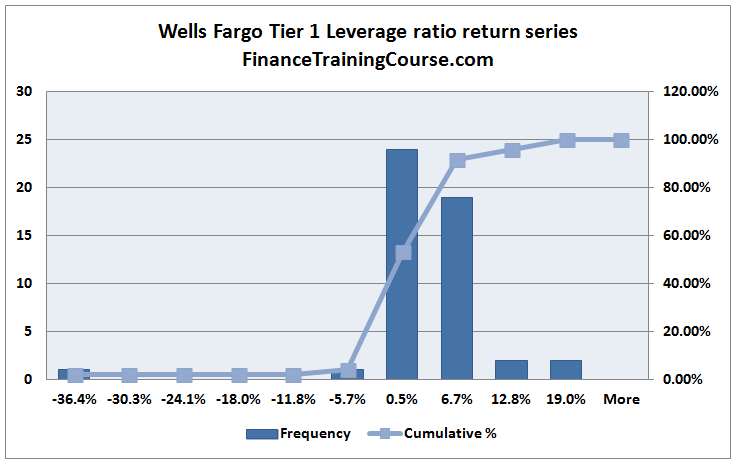
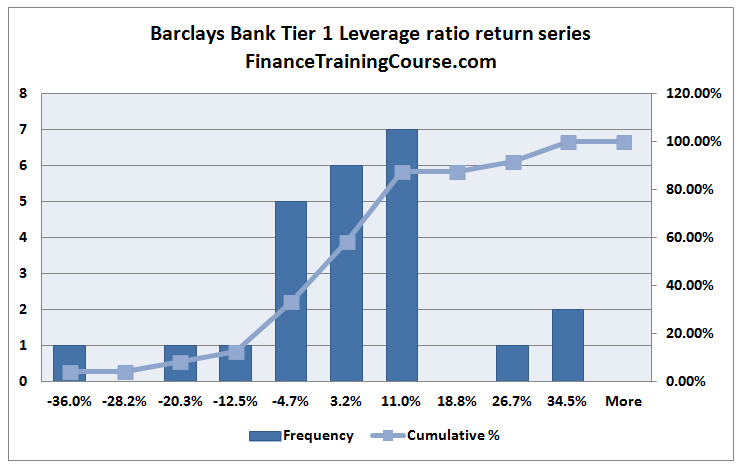
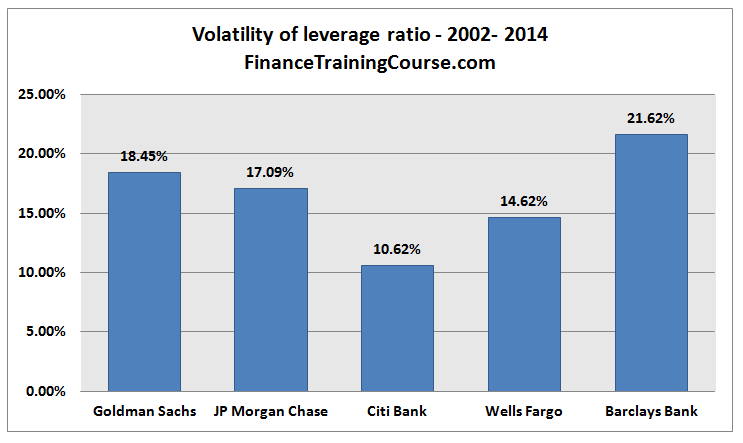
Using the original trail and distribution of changes (return series), calculating volatility follows the same process we have used in our earlier method. The annualized volatility figure for the 5 banks is presented below. Other than Barclays the estimate is based on quarterly changes. For Barclays the estimate is based on semi-annual returns.
Now that we have volatility we need to estimate distance to threshold. For leverage ratio we set two thresholds. The first is the minimum required regulatory leverage ratio. For the banks in our sample this is 8% for the first four and 4% for Barclays.
A bank may breach the minimum leverage ratio requirement for short intervals and most regulators would give some breathing room if the breach is addressed and does not recur frequently. However there is a second threshold beyond which the regulator will have no option but to intervene. Because if they didn’t markets would intervene. Since we have two thresholds, we use this threshold to determine distance to intervention. For the first four banks, the intervention threshold is set at 6.5%. For Barclays we set it at 3%. Distance to both thresholds and probability of intervention are presented next. The lower the distance, the higher the probability of intervention.
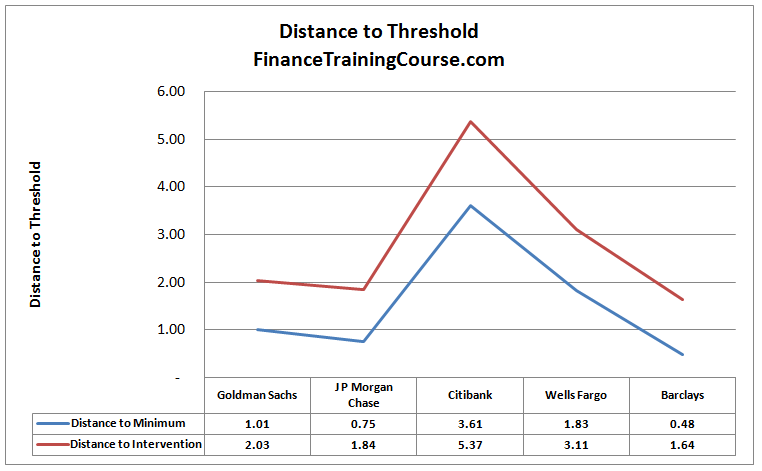
The big surprise using leverage ratio as a tool for estimating probability of intervention is Citibank
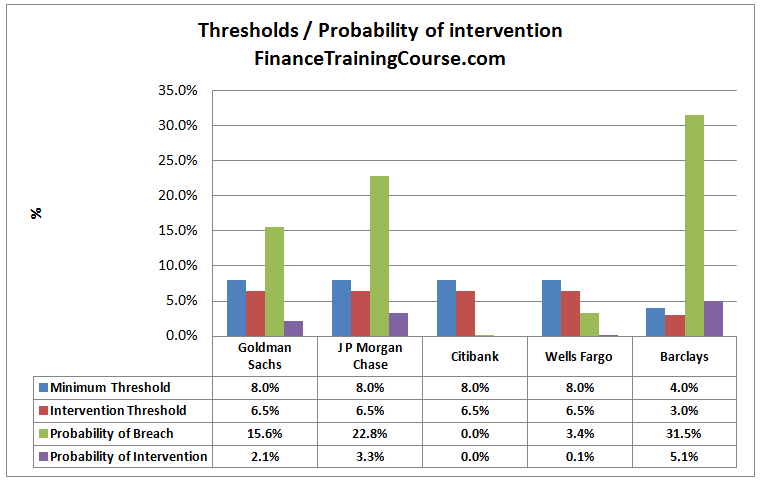
To estimate economic capital, we now need to define an acceptable probability of intervention at the board level. If that probability threshold is set at 0.1%, Citibank and Wells Fargo are adequately capitalized. But Goldman, J P Morgan Chase and Barclays need additional capital.
But wait there is an issue here.
If you remember correctly, we took a simplifying assumption when we described our data set. From a regulatory point of view we are interested in Tier 1 Leverage ratio. Leverage ratio calculated using Tier 1 capital. Because of our data set issues, we had used Shareholders equity as a proxy for core capital.
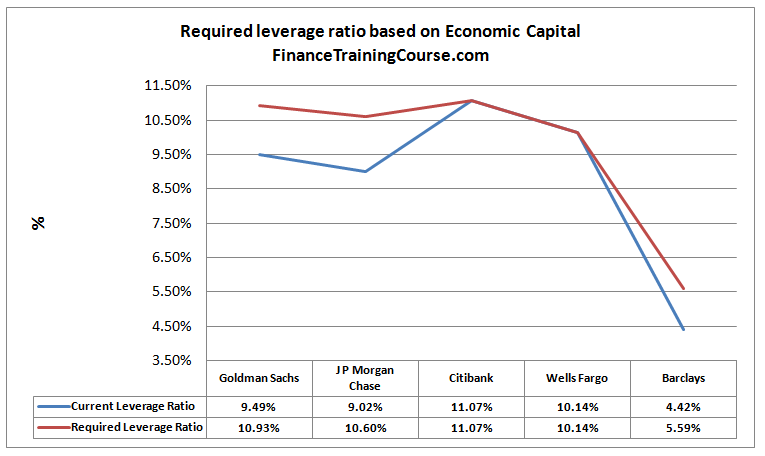
That problem can be easily fixed. Now that we have our results and we have estimates for the most recent quarter of capital levels, we can determine how much additional core capital is required.
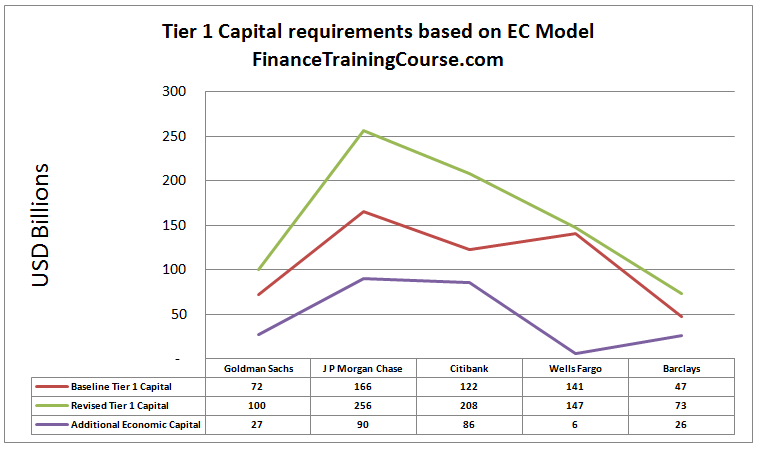
How do these results compare with the first two methods. Interestingly enough the results are fairly consistent when it comes to JP Morgan Chase and Wells Fargo between Method 2 and Method 3. For Citibank while the direction is similar the amounts are dramatically different. And so is the case for Barclays. For Goldman the three models give completely different signals. We will revisit these difference in our next post.