Stability and robustness of portfolio Alphas – the excess return metric – and its implication for portfolio allocation and optimization models – a short thesis on portfolio alpha stability.
How stable is your portfolio alpha – introducing alpha stability
We spent the last few months calculating Alpha and Beta across our theoretical investment universe as part of the portfolio optimization course. Our objective was to introduce a range of portfolio performance measurement metrics and use them to design and test allocation models. The theoretical model and approach we used were crude and simplistic because our objective was academic. We began with a multiyear raw data set that included a mix of securities with a price data set beginning January 2009 and ending October 2016. We used the data set to calculate expected return, standard deviation, beta and alpha over a specified model construction period. The calculated metrics were then used to test a number of portfolio allocation strategies focused around optimizing portfolio alpha. Our final conclusion at the end of the academic exercise was that an optimization model that maximizes alpha will dominate other metric driven strategies.
There were three big issues with this result and the approach that led to it. The first issues is linked with historical relevance. While historical performance is useful to some extent Apple computer in 2008 was a very different animal from Apple computers in 2016. The same holds true for Google, for Nike, for Yahoo, Tupperware and every other security in our investment universe. We wanted to give more weight to recent performance versus historical performance and our original model just worked with the entire data set.
The second challenge is cycles. Product companies, especially technology product companies tend to generate performances that mirror waves. Good years follow bad years. Bad years follow good years. The length of the cycle varies but the cycle exists. A new phone model or operating system is introduced, does well and then slowly fades. If the next model in the pipeline does just as well and analyst expectations are beaten we see the performance trend continue. If it doesn’t we see a correction. Cycle lead to deviation in performance and price deviations. Deviations lead to changes in Beta and excess returns.
While we could clearly see this cyclical trend in holding period returns, we weren’t sure how pronounced this trend would be when we would ultimately model Beta and Alpha.
If portfolio models simply looks at raw alpha without any adjustment for the cycle effect there is a chance that one would over allocate capital to securities that are likely to under perform in the future and under allocate securities that are likely to beat the market benchmark given the cycle effect.
The third issue deals with expected returns. Our daily return measure by definition created a strong bias towards close to zero daily returns. Using that daily return average and scaling it up for to a year would lead to return expectations that would be inaccurate and in most cases understated. More importantly, since the same returns were used to calculate Alpha they would also bias the Alpha measure.
We felt that it would be more appropriate and market relevant to use holding period returns (HPR) rather than average expected returns in our models and use the same measure for estimating alpha. A holding period return measure would focus on actual returns. More importantly, it would also calibrate alpha to realized returns rather than statistical expectations distorted by the underlying distribution assumptions.
Please note that the concept of alpha stability as used above within the context of portfolio optimization is different from the concept of alpha stability within stable distributions.
Portfolio Alpha stability – The experiment
This July in the closing sessions of the Portfolio management and optimization course in Dubai we ran a different experiment than what we had been doing in earlier versions of the course. We asked ourselves if there was some way of upgrading our portfolio allocation models. Specifically, could we answer the following questions?
- How stable are Alpha and Beta across time? How much do they change year on year?
- How does stability change if we switch from expected returns to holding period returns?
- How is this applicable to portfolio allocation process? Is there a cyclical or seasonal factor that we can factor into our model?
To do this correctly we would need:
- A multiyear data set covering at least a few economic or product cycles. Our original data set ran from 2009 – 2016 covering 7 years, so check.
- Annualized calculation of returns, standard deviation, holding period returns, beta and alpha by index. Simple mechanical exercise over said data set, so check.
- A simple cross section of sectors to see if our analysis holds across multiple sectors. Our data set included technology, education, pharma, consumer goods and automobiles, so check for now.
The data set
December 2009 – October 2016. Adjusted price series for the following securities – Google, Yahoo, Apple, Microsoft, University of Pheonix (APOL), Goodyear Tires (GT), Potash (POT), JC Penny, Merk (MRK), Tupperware and Nike.
Beta measured against DJIA (NYSE) and NASDAQ. Alpha estimated using simplified methodology covered in the portfolio optimization and management course.
Portfolio Alpha stability – the revised model
We made the following adjustment to our original model:
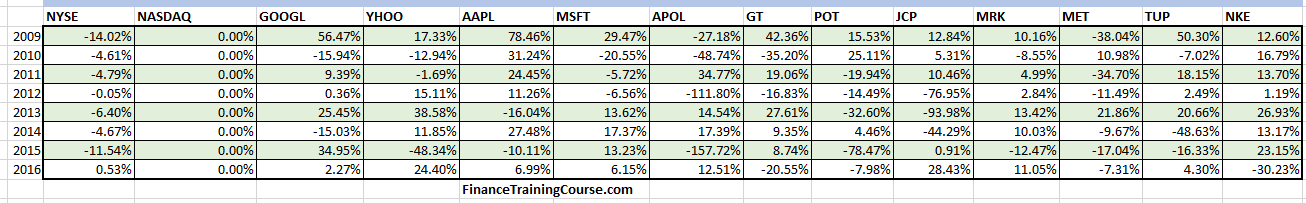
The original data set was segregated into calendar years. All metrics were recalculated on a calendar year basis generating the grid shown below.
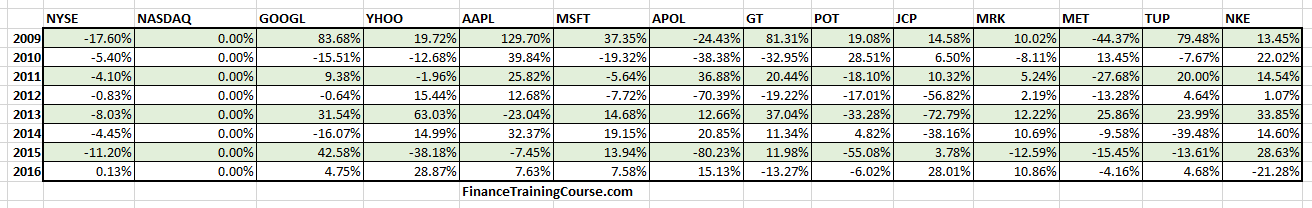
We replaced expected return with holding period returns. If you are familiar with our model, this meant that the calculation of Beta Returns and Alpha were changed. The resultant values were different from the alpha estimates calculated using the expected return approach.
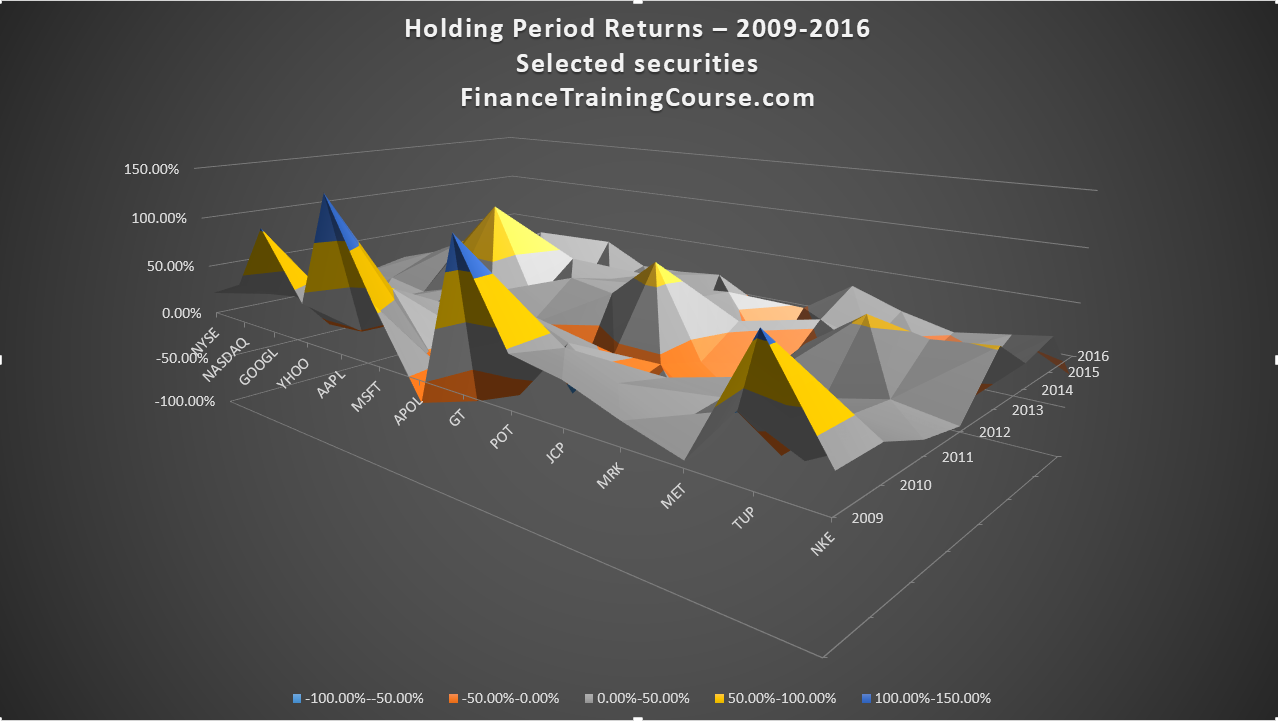
The calculated results and plot are shared below. Holding period return across the data set:
Alpha using annualized expected return across data set – the original approach and model – visualization:
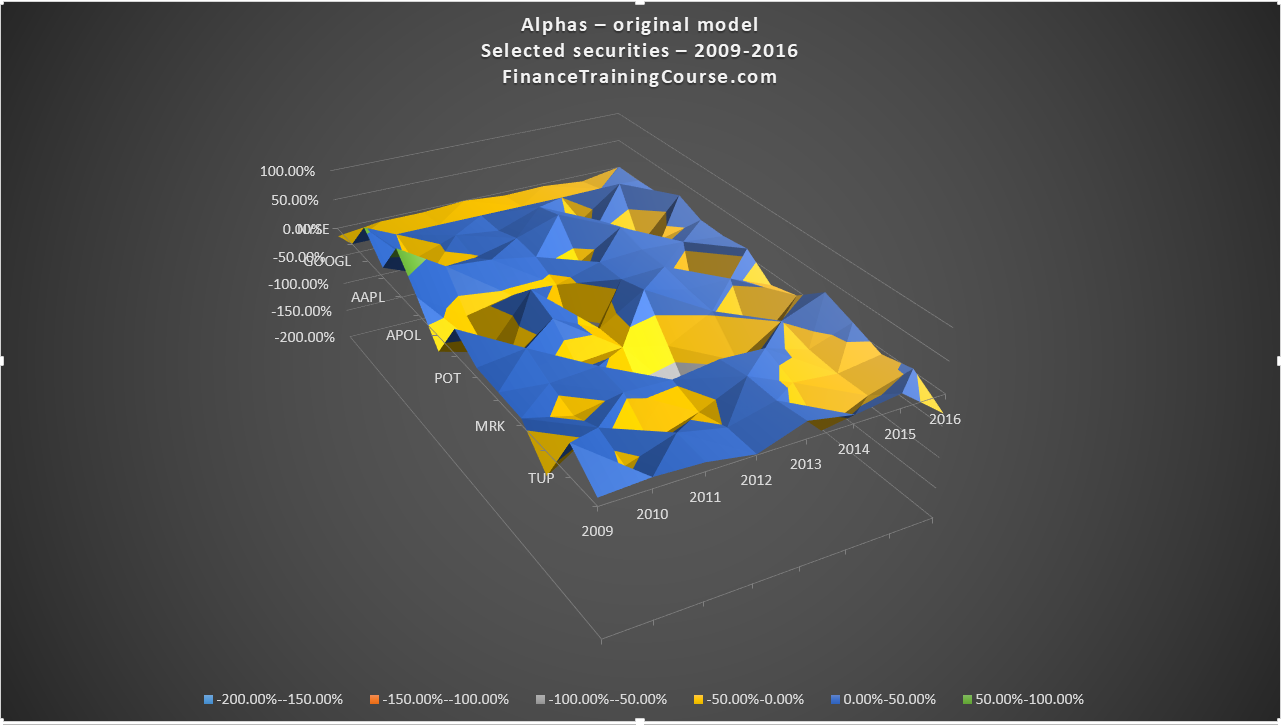
Alpha using holding period return across data set – the revised approach and model – visualization:
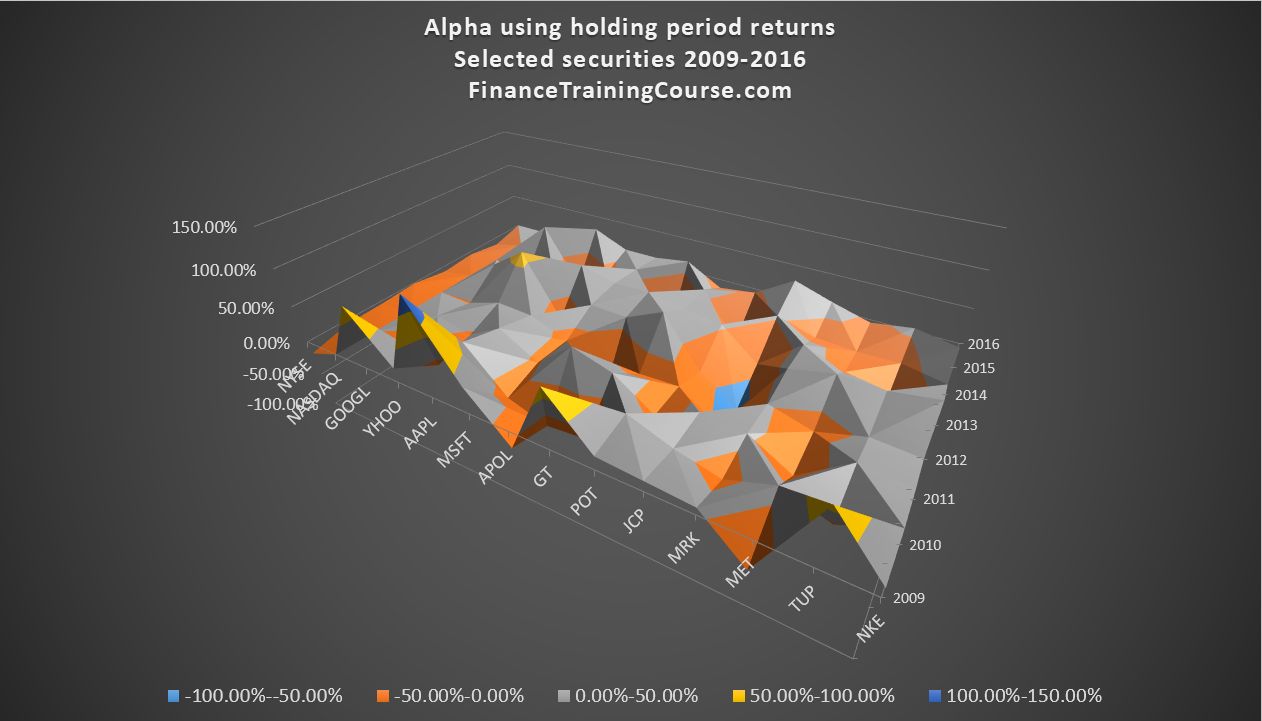
You can clearly see that there is a difference between the two alphas as well as evidence that would support the cyclical assumption we spoke about earlier.
Specifically to answer the questions raised above:
- Alpha and Beta change every year. The magnitude of change varies. One part of the change is driven by the script or company specific factors while another part is driven by the relationship between the firm and the index against which it is being bench marked.
- There is a difference between the two alpha measures. The difference varies from year to year.
- There is a case to be made for crafting a mean reverting alpha allocation strategy that would allocate more in alphas that are below the historical mean for that measure. The same strategy would also allocate less in alphas that are above the historical mean for that measure.
Alpha Stability – The Thesis
From a portfolio allocation point of view, how can we put this to work? Is there a version of a portfolio allocation model that would allow us to use this information to create a more robust allocation strategy?
If our underlying thesis is that the alphas are cyclical then our allocation model should seek to increase exposures in alphas that have underperformed in recent years.
The assumption is that the under performance cycle lasts 12-18 months and such a strategy would allow us to outperform and beat the market when the cycle changes direction. The assumption is questionable but is a good starting point to test the model.
Before we test the model we have to define and calculate two new measures.
Baseline Alpha. A measure of convenience which is defined as the average of all calendar year alphas calculated for a given security.
Alpha deviation. Alpha deviation which calculates the difference between the most recent calendar year alpha and baseline alpha. The portfolio optimization objective function would minimize portfolio alpha deviation. This would lead to the suggested allocation strategy. Under performing alphas would get more weight. Over performing alphas would be avoided.
A simple portfolio optimization solver model can be constructed to minimize alpha deviation. A holding period return comparison across an evaluation period can be performed between an alpha deviation model and an alpha maximization model to see which portfolio outperforms the others.
Admittedly we could use better terminology and definitions for Baseline Alpha, Alpha deviation and Alpha stability. Part of the future model design work would focus on more appropriate, robust and well tested metrics for the three measures. As iterations of the model get tested, we expect that we would identify better and optimization friendly formulations for these terms.
In our next post, we discuss the results of applying this model and comparing the performance of a model based on alpha deviation with our standard alpha maximization model.
An extract published with permission from the upcoming book on Portfolio Optimization Models using Excel Solver
References
- Kiskiras, John and Nardon, Andrea, Portfolio Rebalancing: A Stable Source of Alpha? (January 18, 2013). Available at SSRN: https://ssrn.com/abstract=2202736 or http://dx.doi.org/10.2139/ssrn.2202736
- Levy, Moshe and Roll, Richard, Seeking Alpha? It’s a Bad Guideline for Portfolio Optimization (April 28, 2015). Available at SSRN: https://ssrn.com/abstract=2600084 or http://dx.doi.org/10.2139/ssrn.2600084