Market Risk Metrics – Holding Period Return
2 mins read The Holding Period Return represents the return earned by an instrument (e.g. an equity stock) over the time that it
2 mins read The Holding Period Return represents the return earned by an instrument (e.g. an equity stock) over the time that it
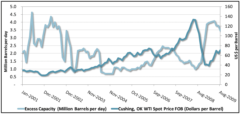
< 1 min read Another way of viewing correlations between variables is to graph the relative price of one item against that of another.
< 1 min read Earlier in our post on Correlation Coefficients, we had stated that correlations change over time and that it is important
3 mins read The correlation coefficient is a measure of the strength and direction of a linear relationship between two variables. It may be
2 mins read A scatter plot is a visual representation of the correlation between two items. It ties in with the correlation coefficient
3 mins read We take a quick look at plotting data and price series in EXCEL for correlation analysis and presentation. The plot