A Corporate Finance Case Study
With 1.4 billion dollars in annual revenues, Electronic Arts (EA) is one of the largest publishers of games for personal computers, Nintendo, Sega and Sony consoles. Between March 1999 and March 2000, EA released a total of 69 games including 30 titles for PC and Sony Playstation platforms. EA’s portfolio of games includes hits like Sim City, the Sims, Command & Conquer, NASCAR, Ultima, etc.
EA now is the exclusive provider of games on all AOL properties and its recent acquisitions include Westwood Studios (Dune, Command & Conquer), Kesmai, Dreamworks Interactive & PlayNation.
EA operates in an industry where a lot is controlled and driven by the cyclicality of the gaming industry. This creates tremendous pressures and opportunities around the transition between new and better gaming consoles or platforms. New gaming consoles are generally introduced at the beginning of the shopping season and have a major impact on EA’s stock price and financial performance.
As a potential investor you feel that EA’s current stock price of 85 a share is a bargain. It is currently 30% off its 52-week high of 125 dollars a share. You have heard some very interesting rumors on yahoo finance (www.yahoo.com) and raging bull (www.ragingbull.com) about how the share price is going to rise in the near future and are wondering if the opportunity is really as big as people are making it sound. So before you go ahead and invest a small fortune in a gaming company, you want to perform some analysis.
Objectives & Game plan of the case study
What is our objective?
- Determine the right price for Electronic Arts’ shares
- Should we invest in this firm or not?
- Is it overpriced or under priced?
- What assumptions are people making, in general, to justify Electronic Arts’ current stock price
Here is the game plan:
- One – Data Gathering
- Two – Industry Analysis
- Three – Understanding Management’s view of the future
- Four – Performing Pre Analysis
- Five – Setting future assumptions
- Six – Projection of Pro-forma Financial Statements
- Seven – Calculating the Cost of Capital
- Eight – Valuing the business
- Nine – Reality checks
We will now walk through each of these nine steps, using the information available to us in the exhibits.
Step One – Data Gathering
In this case, we have most of the information readily available. But in real life you would need to figure out where to get the information you need for your analysis. There are a number of sites that allow you to download financial information from the web. Remember financials are not just one statement; they are the complete filing with the Securities and Exchange Commission(SEC).
Possible Sources:
The best possible source for all the filings that a firm has made over the past years is http://www.freeedgar.com.
If you want the financial statements in the shape of an excel spread sheet, the source that I use is http://www.pwcglobal.com/servelets/edgarscan.
Note
You should be careful with any data that you get from third party sources and ensure that it conforms with the information on file with SEC. Edgarscan sometimes gives you problematic data and it’s generally safe to do your own cross-checking.
If you want to look at financial information along with some standard ratio and financial analysis, two really useful sites are http://www.thestreet.com & http://www.quicken.com.
Any major online broker (www.etrade.com, www.datek.com, www.ameritrade.com, etc) will give you free access to fairly useful analysis if you answer a few questions and become a member. Once again, it is important to perform your own due diligence.
What do I mean by due diligence.? Ideally you should get a copy of the annual report from the business you are looking at. Print outs of the most recent 10-K’s would also do. You have to make sure that the numbers you plan to use for analysis match the numbers in the 10-K. (Information on 10-K available in Appendix A)
Note
Sometimes third party sites do their own pre-processing and reclassifications that you may not agree with. Missing data or incorrectly classified information can have a major impact on any projections that you generate. Sometimes simply totaling the numbers included in subtotals can identify missing information or reclassification (sum all line items under various Heads of Accounts like Current Assets, Assets, Liabilities, etc)
Step Two – Industry Analysis
The key purpose of performing industry analysis is to understand how different players relate to each other. The amount of money any business makes is directly proportional to the power it wields over the industry and over other players and in the same way it also helps us recognize the power other participants yield. The analysis allows us to understand historical performance of the company as well as the entire industry and also helps us set expectations for future results. It’s all about understanding the industry structure and the strategic position of each player in the market, in both individual terms and as a group.
In EA’s case, the industry structure is below:
- Game Console Manufacturers (Sony, Nintendo, Sega)
- Hardware components suppliers (Chips, Semi Conductor, Electronics firms)
- Game publishing houses (Electronic Arts, Blizzard Entertainment, etc)
- Independent game publishers (Fraxis, etc)
- Retailers
Who controls standards
Power very closely follows those who control standards. Really good examples of this are Microsoft and Intel. One organization controls anything and everything to do with software on the Intel platform and the other owns the Intel platform. If you take a look at the performance of both these companies over the past ten years, you can see how the capability to control standards, that affect large segments of your market, can have a healthy effect on your financials.
In EA’s case, the hardware standards are in the hands of Sony, Nintendo and Sega. Unlike Microsoft and Intel who need each other to maintain the status quo, EA’s has limited power over console manufacturers, which limits their bargaining power in the industry. Nintendo, Sega and Sony have ensured that game publishers do not have any control over the standards set by this group. Retailers also have a similar problem since they have no control over supply and demand. This is also controlled and maintained by the console manufacturers. Since the consoles use generic chips and are not tied in with any major manufacturer, hardware component suppliers also do not have any source of power.
As profits follow those who can dictate terms, in this case we would not expect EA to earn an outstanding return. EA cannot dictate terms to retailers or console manufacturers. They will make money and they will control the intellectual property rights of the games they publish, but within the game console industry, unless something drastic happens, they will never be able to dictate their terms.
The drastic change in this case is the Internet. It’s open country out there right now, unclaimed by Sony, Sega, Nintendo or EA.
Step Three – Management Discussion and Analysis
This is probably the most important section in the financial analysis since it lays out management’s game plan.
EA in the past has tried not to tie itself with any major gaming platform. This indicates that the current management understands the stranglehold of power that the console manufacturers have over this industry.
The annual report reveals that EA is now moving in two strategic directions.
The first is a move away from totally proprietary setups such as Ninetendo. (30 games for PCs, 30 games for Sony, only 6 for Ninetendo).
The second move is towards dominating the Internet gaming platforms. The recent acquisitions as well as the deal with AOL and EA.com points towards this direction.
What will this mean? Right now EA pays more than fair cost for the cartridges that it purchases from Nintendo. It also pays licensing fees for the right to write games for platforms. As EA moves towards more open segments, these costs will reduce. This would have a direct impact on what it costs EA to produce and distribute games in general. At the same time, it is important to remember that EA is also paying out a lot of money to other gate keepers (AOL) now and for the next four years to gain access to AOL’s customer base. Would the two effects net off write each other off we are not sure, but we will take a look at this in later sections.
Step Four – Pre Analysis
Before we go ahead and set assumptions, some work is required to understand the existing situation (cost structure, profitability, year by year changes).The first step is to calculate the year-to-year changes for all line items in the balance sheet and income statement, which is what we show in the table below.
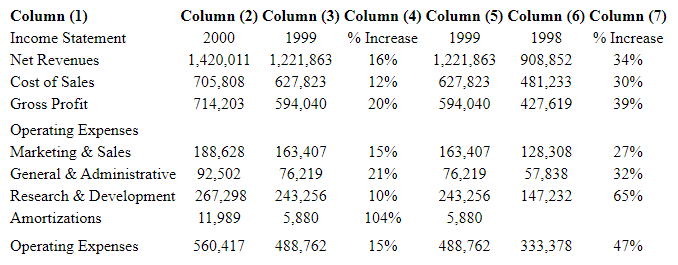
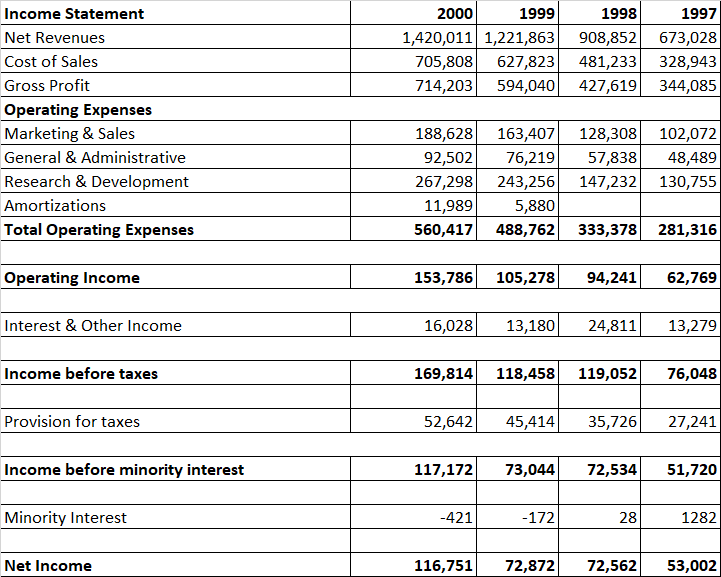
Changes in the income statement
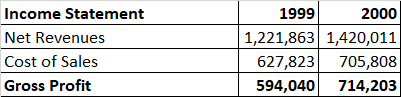
Take a look at net revenues in 2000 and 1999. The numbers are 1.42 billion dollars and 1.22 billion dollars respectively. Calculate the annual increase in sales as:
% Increase in Revenues = (Revenues in 2000 / Revenues in 1999) – 1 , which comes out to be 16%.
Similarly calculate the increase in cost of sales as:
% Increase in Cost of Sales = (Cost of Sales in 2000 / Cost of Sales in 1999) – 1, which comes out to be 12 %.
Important- Do your checking
The table below does all the calculations for you, but it would be a useful exercise for you to crosscheck your numbers.After we have taken a look at the numbers, let’s see what they tell us. . Column (4) and Column (6) show that
- the increase in net revenues declined from 34% per year to 16% per year in 2000
- the increase in cost of sales declined from 30% per year to 12% per year in 2000
- there were similar reductions in all items under operating expenses in 2000
Can we learn anything from this information?
For starters, we know that EA is in the midst of a slow down (probably a transitory period between new game consoles). But the real interesting thing to notice is that management is adept enough to slow down the business at a very short notice and maintain a profitable cost structure, thereby displaying management efficiency. As we will see later when we’re forecasting, profitability will take a blow , but the firm manages operating expenses very well within set parameters so that their growth is not faster than revenue growth. This is easier said than done and it speaks positively about EA’s management.
The situation is very similar to slowing down a run away locomotive without overturning it. The next step is to calculate each line item as a percentage of sales for all the years for which we have data. Let’s start with the balance sheet in 2000. We already know that the Sales or net revenues between 31st March 1999 and 31st March 2000 were 1.42 billion. Here is some more information from the Balance Sheet:
EA had 339 million dollars in cash. 339 million divided by 1,420 Million is .24 or 24%. That is, we have simply expressed the amount of cash as a percentage od sales, as we will do with other items as well.
EA also had accounts receivables of 229 million dollars. 229 million divided by 1,420 Million is .21 or 21%.
Finally EA has gross fixed assets of 406 million dollars. 406 divided by 1,420 is .29 or 29%
What do these statements mean?
For every dollar of sales that EA generates, it needs 24 cents in cash, an additional 21 cents in receivables and 29 cents in gross fixed assets to service those sales. These are the balance sheet items that are required to support EA’s revenue generation capacity. Now let’s take a look at the income statement for 2000 and EA’s cost structure.
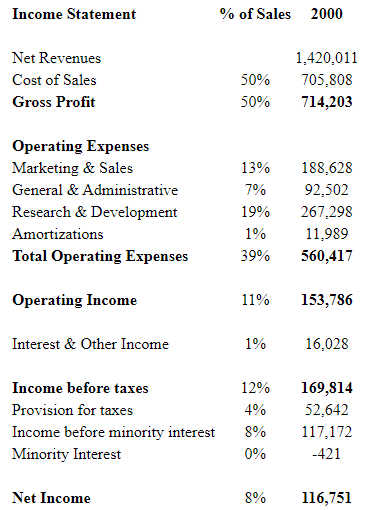
Here are the highlights of EA’s Income Statement for the year between 31st March 1999 and 31st March 2000.
- EA generated 1.42 billion in sales.
- 705 million of these were spent on direct costs associated with these sales, that is the cost of sales. 705 divided by 1,420 is approximately 50%.
- EA spent an additional 560 Million in operating expenses. 506 million divided by 1,420 is 39%.
- EA also earned 16 million dollars on its cash and securities balance, paid 52 million dollars in taxes and earned 116 million dollars in all.
What does this mean? For every dollar in sales, EA spend 50 cents on cost of sales, 13 cents on marketing, 7 cents on administration, 19 cents on research and 4 cents on taxes. This leaves EA with 8 cents on each dollar of sales that it can put in the bank. Once again why is it important to do this?
In order for you to project the financial statements, it is absolutely essential that you understand
- what level of assets or liabilities are required to support and/or enhance the sales volume
- how and where each dollar of revenue is spent
You need to have this knowledge to make realistic assumptions, which lead to more accurate projections for the business.
Expressing as a percentage of sales
The income statement as a % of Sales
In the table below, we express the Balance Sheet items also as percentages of sales.
The Balance Sheet as a % of Sales
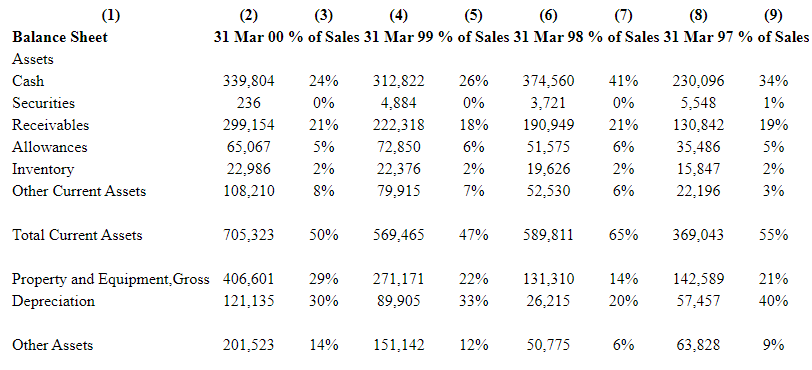
From the table above, what we see is that:
- Receivables and allowances for doubtful accounts have been maintained as a constant percentage of sale.
- Inventory is a fixed 2% of sales. This makes sense since, compared to the value of the software, the disk and the packaging of the game itself is essentially worthless.
- Cash in hand has been held at relatively stable absolute level but has been declining as a percentage of sales. This is interesting, since in a profitable business with around 50% gross margins, increasing sales should result in improving cash positions.
The current scenario may either indicate better cash management (increasing investment in short term securities), increasing investment in new games and businesses (growing balance sheet), increasing sales (increasing working capital demands), or a cash flow problem. In EA’s case this can also be due to the investments made in acquisitions and business alliances as well as the impact of growing sales.
Step Five – Setting Assumptions
Ways to set assumptions
There are a number of ways in which you can set assumptions. You could
- Look at historical data, derive averages, assume that the firm would maintain these averages and just use them as a basis.
- Adjust the historical average by an estimate of historical differences between your average and the actual year by year results
- Use an adjusted average (try and add ‘adjusted average’ on session 0…as simple stand alone concept…) that gives more weight (allows to have more impact) to figures obtained for more recent years.
- Finally, use the historical values as a base and adjust them according to your understanding of how management’s action would effect them.
When projecting business financials, we make assumptions at two levels. First you have to state your understanding of the direction the management plans to take and its impact on the financial performance of the business. These are high level assumptions about the strategy and focus of management and the positioning of the business viz a viz its competition. The next step is to translate these high level statements (about strategic management and positioning) to numerical percentages and use them to generate projected financial statements.
High level assumptions
What are the high level assumptions for EA?
- EA will move away from the proprietary platforms. It will still produce games for Nintendo & Sega, but no platform will have a dominant position in the future. The more proprietary a platform, the smaller the number of games produced will be.
- Growth will continue in the core business due to the introduction of faster and better consoles by Sony, Nintendo and Sega. Growth will also be increasingly driven by the success of EA.com in becoming the core gaming platform for the internet.
- Cost of goods sold will reduce as a percentage of sales because of the reduction in licensing fees
- Marketing expenses will increase due to the AOL deal and similar contracts with other portals on the net.
- Research and development expenses will remain stable as a percentage of revenues but increase on an absolute basis, as EA explores cutting edge technology in creating gaming environments for more powerful platforms as well as the internet.
How can we translate these high level assumptions to low level detailed numerical assumptions for EA?
Ground rules for setting low level assumptions
Here are some ground rules:
Assumptions are only set for line items, so we would set a number of assumptions for cash, securities, net receivables, inventory, etc but not for grand totals (Assets) and sub totals (Total current assets). These (totals and subtotals) would be the sum of the projected numbers. For example, current assets would be the sum of Cash, Securities, Net Receivables, Inventory & Other Current Assets.
Since we are projecting towards the future and the business is growing we need to take a decision on the financing strategy. Growth is expensive and someone has to pay for it. Increasing sales require higher levels of cash, receivables, inventory and fixed assets and other possible additional resources required. As you buy more on credit, your short-term liabilities also increase. Someone has to pay for all of these increases. There are two possibilities:
- The business can issue debt that can be used to finance growth. In such a scenario any differences between the assets and total existing liabilities and equity will go into long term debt.
- The other option is the business will go out and issue equity. Differences between assets, total liabilities and existing equity will now flow into shareholders’ equity.
Example
Let’s work with an example that explains (a) and (b).
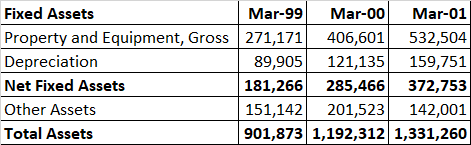
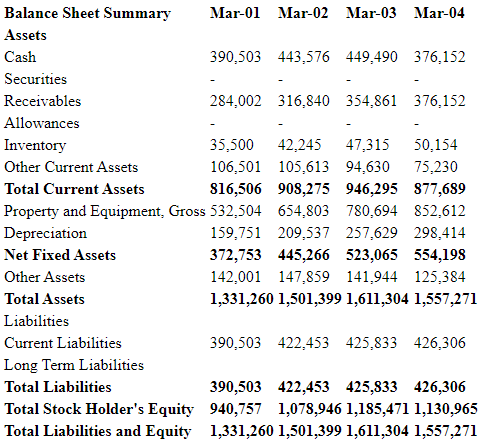
Here is the balance sheet for three years (1999, 2000, and 2001). The first two years quote historical results while the third year (2001) is a projection. All figures are in 000’s.
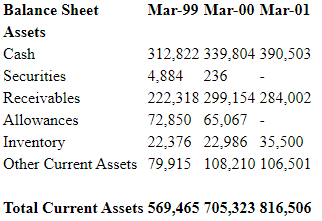
Notice that between March 1999 and March 2000, current assets have increased by 135,858.
Now take a look at total assets. Over the same period total assets increased by 290,439. This includes the increase in current assets mentioned above.
Where did the money come from to buy these assets?
Let’s take a look at the other side of the balance sheet to see if we can find some clues. As discussed, there are only two possibilities. The business can either borrow the money (an increase in liabilities) or it can issue more shares (an increase in shareholders’ equity).
What did EA do?
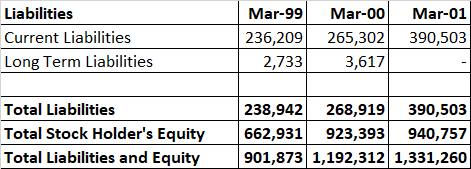
One important clarification is that there are two separate borrowing options. One is short term or current liabilities, while the other is long term debt. Our decision is about the choice between equity financing and/or long term debt financing. Current liabilities are part of working capital and would increase or decrease depending on sales and production levels. They should not be considered as debt which could be used for financing purposes. In the example above, the borrowed money came from current liabilities. But if you look at the figure against long term debt in the first projected year (2001), you will notice that it is zero.
What does this have to do with assumptions?
You need to decide for the purpose of projections, whether you want to borrow money or issue equity. Your model will be easier to build and much simpler to understand if you opt for one of the options (either debt financing or equity financing) and not both. Once the model (projections) is ready, then you can refine your financing options and use a mix of equity and borrowing.
In our working we will generally assume the use of equity financing only. This means that all additions to the asset side of the balance sheet will be financed by equity. Well they borrowed some money (to the tune of 29,977) and asked their shareholders to invest an additional 260,462 dollars. The interesting thing is that it all adds up. Borrowing 29,977 and investing 260,462 (total 290,439) financed an increase in assets of 290,439.
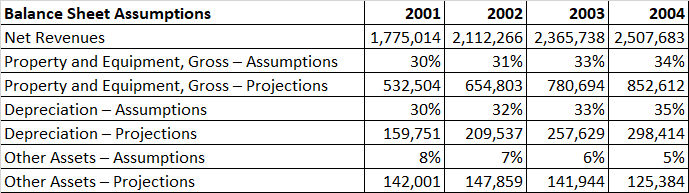
Finally these are the assumptions that we will be using to project the balance sheet. All of these figures are described as percentage of sales.
Balance sheet assumptions
EA will need a cash balance of 22% of sales in 2001 to ensure that sales hit their objectives. It will then start going downwards and will remain at 15% for all years after 2003.
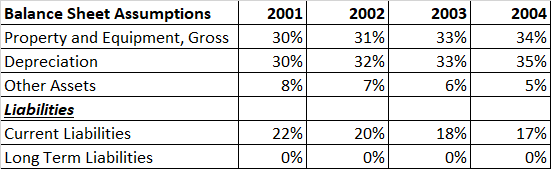
Rather than projecting receivables and allowances, we are using Net Receivables. They hover between 15% and 16% and then stay constant at 15%. Inventory stays stable at 2% for the duration of the projection. Other current assets decline on an annual basis and then stay constant at 3% after 2003.The table below shows the assumptions for the Balance Sheet in terms of growth that will be achieved.
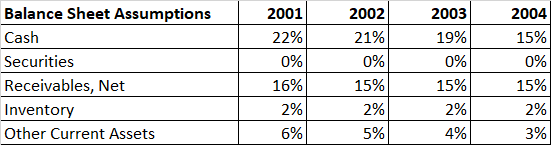
The figures in 2004 are the terminal assumptions. This means that for all years beyond 2004, these numbers will remain stable at these levels.
One of the most common mistakes made is that of projecting depreciation as a percentage of sales. Always ensure that you are projecting depreciation as a percentage of Fixed Assets.
Since we decided to opt for equity financing, equity is not projected. It serves as a plug. This means that for projections it is defined as the difference between Assets and Liabilities. If the projected Assets are 10,000,000 and projected liabilities are 4,000,000. Shareholders equity will be the difference between them, which in this case is 6,000,000.
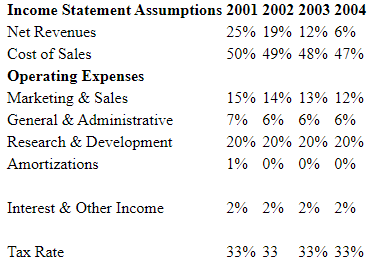
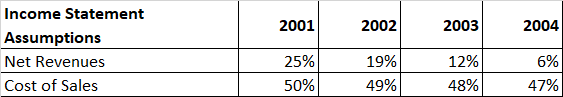
Income statement assumptions
Here are the assumptions for growth in the items in the income statement. Once again the assumptions under 2004 are the terminal assumptions. We are assuming that sales will continue growing at 6% till infinity, cost of sales will remain at 47%, only 12% will be spent on marketing and sale, etc.
Step Six – Projection of pro-forma statement
Let’s do a review of all the things that we have done so far. We have gathered data, performed industry analysis & pre-analysis, understood management’s view of the future and generated assumptions. Now the only thing left is to figure out how the business would perform in the future. Projecting financial statements into the future involves the following steps.
1. Projecting the income statement
2. Projecting the balance sheet
Projecting the income statement
Let’s start with the income statement.
Take a look at net revenues & cost of sales
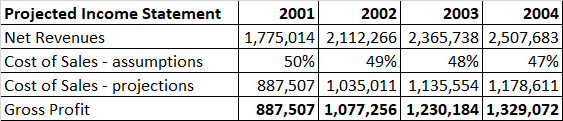
In 2000 Revenues and Cost of Sales were 1,420,011 and 705,808 respectively. Our assumptions for growth for 2001 are as under:
Projecting revenues
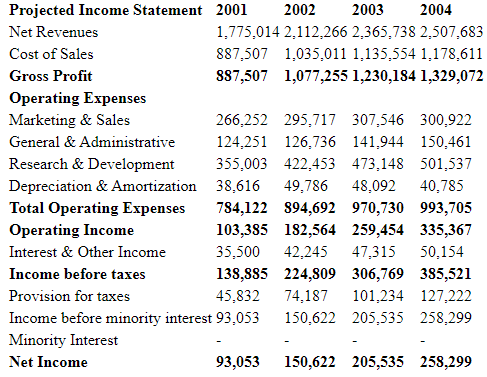
We expect Sales to grow by 25%. This means that the 2001 sales figure will be
2001 Sales = 2000 Sales * ( 1 + 25%) = 1,420,011 * (1.25) = 1,775,014
What would the figure be in 2002? We expect revenues to grow by 19% in 2002 from their level in 2001. This means
2002 Sales = 2001 * ( 1 + 19%) = 1,775,014 * (1.19) = 2,112,266
Similarly 2003 sales are
2003 Sales = 2002 Sales * (1 + 12%) = 2,112,266 * (1.12) = 2,365,7382004 sales would be
2004 Sales = 2003 Sales * (1 + 6%) = 2,365,738 * (1.06) = 2,507,682
Putting all of it together we have the projected sales for the next four years

Projecting Cost of sales
The next item on our list is cost of goods sold or cost of sales. Our assumptions for cost of sales for each of the next four years are as under:

Revenues or sales are the only item that is (or can be) projected sequentially on a year-by-year basis. Everything else from now on, is projected as a percentage of expected sales levels. Multiplying Revenues by the cost of sales assumptions gives us the following numbers for each of the next four years:
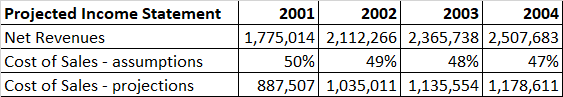
For example: for 2001 Revenues*Cost of sales assumptions = Cost of sales projections=> 1,775,014*50% = 887,507
Projecting gross profit
Gross Profit is the difference between Revenues and Cost of Sales.
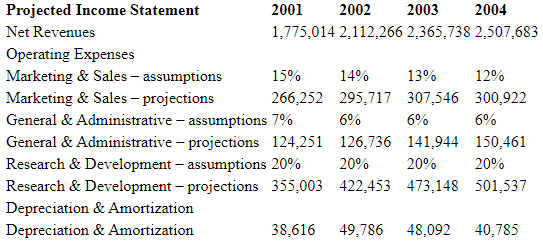
Projecting Operating Expense
Operating Expenses are also calculated using the same approach as cost of sales. We simply multiply sales by the percentage consumed by that specific expense to get the projected numbers.15% of Sales is the marketing expense for 2001 = 1,775,014 * .15 = 266,252
Depreciation and Amortization is the only item that requires special attention. Depreciation is calculated as a percentage of Fixed Assets and not as a percentage of Sales, which is why we have blanked out its assumptions.
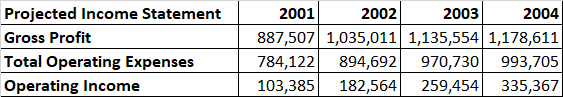
Calculating operating income
Operating Income is the Gross profit calculated (as above) less the sum of operating expenses. Operating Income is also known as Earnings Before Interest & Taxes or EBIT for short.
Projecting interest expense
The next item in line is interest expense or income. Calculate this in any of three ways.
- If we have details of the long-term debt a business has, you can calculate the interest payment by multiplying the interest rate on the debt with the amount of the debt.
- If the business has multiple loans, sum up the individual interest payments on various loans and you have the figure for total interest expense available.
- Alternatively calculate the cost of debt (interest rate) and assume that it will remain constant. Multiply the cost of debt by the outstanding debt and you will get the total interest expense.
In EA’s case the situation is slightly different. EA has no debt or loans and since it carries significant cash and short-term securities on its balance sheet, it actually earns interest. Since we do not have a detailed breakup of EA’s investment, we use a simpler approach that links the interest income to sales. A much better approach is to assume that interest earned is a percentage of cash on hand.
We are now two short steps away from the magic number called Net Income.
The first step is the calculation of the tax EA will pay over the next few years and the other is Minority Interest. EA’s tax rate over the past few years has been hovering between 33% and 35%. We assumed that the tax rate would remain constant at 33% for the next 4 years as well as in all years beyond that period. The other item is minority interest. We assume that EA buys out the minority interest and adjusts the cash position to reflect that change.
The results of these two assumptions are below.
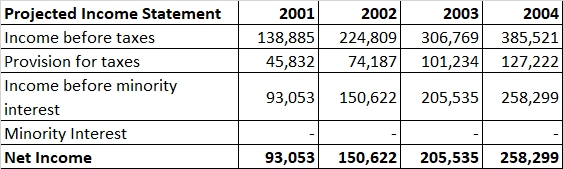
Putting it all together, the Projected income statement for Electronic Arts is:
Projecting the balance sheet
Projecting the balance sheet requires steps similar to the ones that we have just gone through above. There are however a few subtle differences. In the income statement with the possible exception of interest expense, we express everything else as a percentage of something (of sales). In Balance Sheet projections, projected items can be classified in three or four categories:
- Items projected as a percentage of sales. Almost all current assets and liabilities will come under this category.
- Items expressed as a percentage of assets. Generally express amortization as a percentage of goodwill, while project depreciation as a percentage of gross fixed assets. Another example is allowance for bad debts. Express this as a percentage of receivables rather than sales. Alternatively you can express all of these items on a net basis (Net Fixed Assets, Net Goodwill, Net Receivables), but you would need to come up with approximations for all three of these items under the income statement (amortization, depreciation and write-offs).
- Items projected as a plug. We briefly touched upon this in our earlier discussion on assumptions. Depending on which route is taken in the projections, Equity or Long Term debt will be projected as a plug rather than as a percentage of sales.(As mentioned earlier, if for example we take the equity as a plug, it simply means that for the purpose of projections equity is defined as the difference between Assets and Liabilities. If the projected Assets are 10,000,000 and projected liabilities are 4,000,000. Shareholders equity will be the difference between them, which in this case is 6,000,000.)
Projecting current assets
Let’s start with current assets. The assumptions for current assets are below:
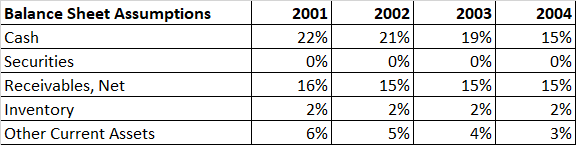
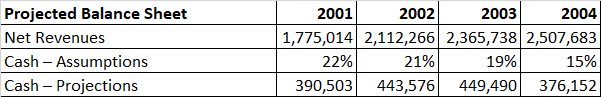
Take a look at cash. In each of the next four years (2001 – 2004) cash starts of with 22% of sales and then declines to 15% of sales in the terminal year, as identified below as well.

What are the projected Sales levels for the same years

Multiplying sales levels with the projected cash percentages gives us the projected cash levels for each of the next four years. A detailed working is below:
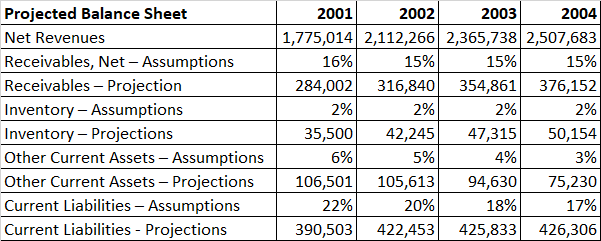
We use a similar approach to project Net receivables, Inventory and other current assets as well current liabilities. Details of the working of these heads of accounts are also below.
Project property, plant and equipment (Net as well as gross) and other assets as percentages of sales. Depreciation, as mentioned earlier is expressed as a percentage of gross assets and not as a percentage of sales.
Putting it all together, we now have a complete picture of the asset side of the balance sheet. We also have the projected numbers for current liabilities and since EA has no long-term debt, we have a complete picture of the liability side also.
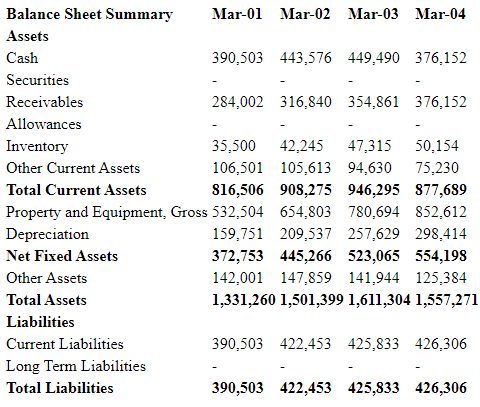
The only thing that now remains is projecting the shareholders’ equity portion of the balance sheet and we are done.
Calculating equity
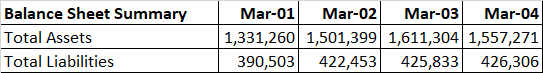
Since we made an assumption earlier on about using equity for the financing needs of EA, shareholders’ equity is the plug in this projection. This means that we use shareholders’ equity to balance the Asset and Liability side of the Balance Sheet. In order for us to do this, we need the figures for total projected assets and the total projected liabilities for the next 4 years; these figures are below:
If Total Assets have to balance Total Liability and Equity, the right equation would be:
Total Assets = Total Liabilities + Share holders Equity (Also known as the Accounting Equation)
Or
Shareholders Equity = Total Assets – Total Liabilities
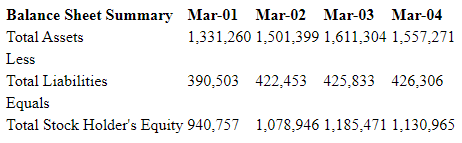
We now have all of the missing pieces in place. The projected balance sheet of EA for the next four years is below:
Calculating free cash flows
As all the tough work has been done, only the easy and fun stuff remains now. What are free cash flows? The Net Income a business declares and the actual cash that it generates are two separate things. (A little later we are going to discuss the importance of the cash position / situation of a business.)
For valuation purposes what really matters is the amount of cash a business generates. Since net income is not the same as the cash generated by the business, we need to make a few adjustments to get from net income to the actual cash flow for the business. What are the adjustments?
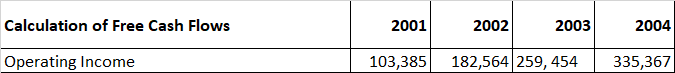
Step 1: Operating income
Our starting point is operating income. Operating income is also known as earnings before income and taxes or EBIT. This represents the amount of money the business makes after we deduct cost of goods sold and operating expenses from Sales but before the firm pays interest payments and taxes.
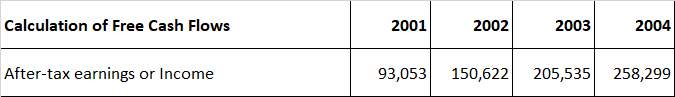
Step 2: After tax operating income
The next step is to calculate after-tax operating income. Based on our assumptions we find that EA’s tax rate is 33%. Which means that every year, on every dollar earned, EA pays 33 cents in taxes. To calculate after tax operating income, we multiply operating income by (1 – tax rate). In this case (1 – tax rate) = 77%.
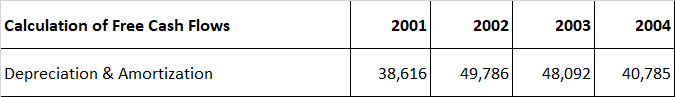
Step 3: Add back non-cash charges
We now want to add back non-cash charges to net income. Non-cash charges are charges that are included as expenses but have no impact on the flow of cash to and from the company. Depreciation is a classic example of non-cash charges. It’s a charge that is used to fairly distribute the cost of an asset over a number of years (see note on depreciation) but doesn’t require the business to pay any additional amounts. Similarly, amortization is another frequently encountered non-cash charge. One of the common assets amortized is goodwill. Once again, the objective is to fairly distribute the cost of acquiring goodwill over a number of years. There is no inflow or outflow of cash required. We need to add these items or charges back because they have already been included in the calculation of operating income.
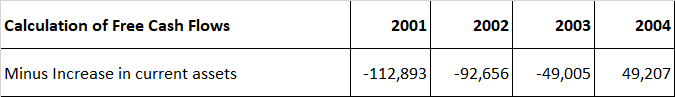
Step 4: Deduct change in net working capital
The calculation of net income does not include the outflow of cash that takes place in the event of an addition in assets, which have been acquired to produce that income. Neither does it include the short-term financing provided by suppliers and employees when they sell their services on credit. The difference between these two items leads to a change in net working capital. A simple way to calculate this is to subtract the change in current liabilities from current assets. We can then subtract the result from net income.
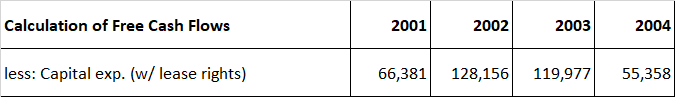
Step 5: Deduct total capital investment or expenditure
Working capital changes are short-term investments, which is why they involve current assets and current liabilities only. Businesses also invest in long term assets. These expenses are called capital expenditures, capital expenses or capital investments. These again are cash expenses that have not been included in the net income calculations and hence are subtracted. This is the final adjustment to net income.
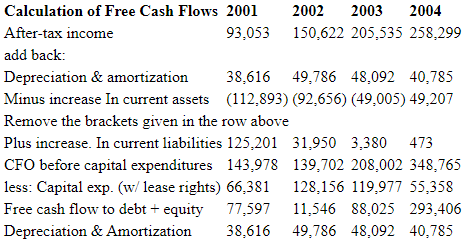
Steps in action
Let’s review what we have done. Starting with after tax operating income, we added back non-cash charges (depreciation and amortization). We then made an adjustment for changes in net working capital (subtracted the net change in current assets and added the net change in current liabilities). Our final step was subtracting the total capital investment or expenditure. We have now arrived at the final number:. The free cash flows generated by a business in any specific year.
Let’s see if we can work these five steps through with our current example of EA. From the income statement we get the projected operating income:
77% of these numbers is the after tax operating income .
Also from the income statement we get depreciation and amortization expense for the projected years. These are the noncash charges which we add back to after-tax earnings
The next step is to calculate the increase in current assets from year to year. That is, the difference between the current assets of this year and those of the preceding or following year.
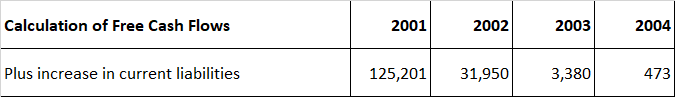
Then calculate the increase in current liabilities from year to year, which is, the difference between the current liabilities of the present year and those of the preceding or following year.
Finally, we calculate capital expenditure, which is, the difference between Gross Fixed Asses of the present year and those of the preceding or following year.
Putting it all together we have:
Step Seven – Cost of capital
When we discussed cost of capital above, we just did a high level pass over the theory but did not get into any of the details. We will now try and work out how to calculate the cost of capital for EA. The cost of capital calculation takes the following steps.
- Calculate the cost of debt. This requires calculating asset beta, debt beta, the risk free rate of interest and the cost of debt. Calculating asset and debt beta is beyond the scope of this version of the course but is covered in depth in advance corporate finance. Alternatively and for the purpose of EA, if you know the debt structure and the terms and conditions associated with that debt you can approximate the cost of debt.
- Calculate the Cost of Equity. This requires determining values for equity beta, the risk premium and the risk free rate of interest.
- Once you have the cost of equity, the cost of debt and the debt structure (how much debt financing vs. equity financing has been used), you are ready to calculate the cost of capital.
In EA’s case we will not be able to go through this whole exercise since EA has no external debt. We will make two simple approximations. One, that EA is completely equity financed. The second approximation stems from the first. As only equity financing is being used EA’s cost of equity and EA’s cost of capital is the same.
Sources of Beta
There a number of firms that publish beta books, listing the betas for a number of securities. If you want an immediate and close approximation www.quicken.com generally has beta’s for a number of equity securities listed on NYNEX and NASDAQ.
What is the right risk free rate of return?
In academic circles there is a fairly intense debate about what is it that represents the true risk free rate. We know that the starting point is government bonds. But then are we talking about 1 year, 10 year or 30 year bonds? Additionally, are the current yields on government debt a fair representation of the risk free rate? For the purpose of our calculations, we will use the 30-year bond yield as the risk free rate and ignore the above questions.
What is the right value for the risk premiums?
If you thought the risk free rate debate was intense wait till you get to the risk premium! Before NASDAQ and Dow reached their current dizzying heights there was widespread consensus in the market that the risk premium of equity, securities lay somewhere between 5% and 8%. This view was based on the historical differences between yields on treasury bonds over a period of 30 – 50 years and returns on shares over the same period. However recently the range has widened even further and there are Wall Street analysts who use risk premiums as low as 2 – 3% rather than the more traditional 5%.
For the purpose of our calculations in this case we assumed a risk premium of 5%.The table below summarizes our assumptions:
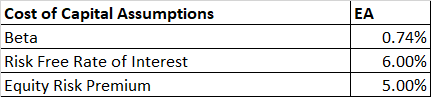
Given these figures, the formula for calculating cost of equity is fairly simple:
Cost of Equity = Risk free rate of return + Beta * (Risk Premium)
Plugging in the values above we get Cost of Equity = 6% + .74 * (5%) = 9.7%
WEIGHTED AVERAGE COST OF CAPITAL (WACC)
The weighted average cost of capital is an adjusted average of the cost of debt and the cost of equity.
The formula for weighted average cost of capital (WACC) is below:
WACC = Cost of Debt * (1 – tax rate) * WeightD + Cost of Equity * WeightE
WeightD: refers to the percentage or portion of the overall structure that the company finances through debt. The “D” denotes debt, of course
[WeightD = Debt / (Debt + Equity) and Debt = Long Term obligations of the business]WeightE: refers to the percentage of the overall structure that the company finances through equity. Obtain this percentage easily with the following formula:
WeightE: 1- WeightD
Since in this case debt is zero the weight is zero and WACC simply equals the Cost of Equity
So the Weighted Average Cost of Capital for EA is 9.7%. This is the rate that we use to discount EA’s cash flows.
Step Eight – Valuation
Basic Principles
The really tough part in valuing a business is the pro-forma projections and the calculation of free cash flows. Major errors in a valuation exercise usually occur in these two steps. Hence if you understand the above section, valuation should be a piece of cake.
What is valuation? Valuation determines the current worth of a business, where it generates a certain amount of cash flows over a period of time and keeps generating a stable amount of cash till infinity. It’s an application of the present value principles we discussed in our earlier time value of money post.
Valuation consists of the following key steps:
- Determining the appropriate cash flows
- Determining the appropriate discount rate
- Calculating the appropriate discount factors
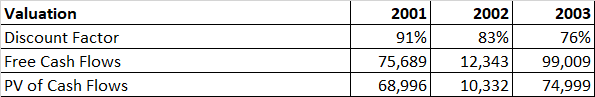
Till this point we have already obtained the information required in step one and two. The appropriate cash flows are the figures for free cash flows that we have generated after such pain staking effort. The appropriate discount rate is the weighted average cost of capital (WACC). We calculate this as 9.7% in EA’s case. While the appropriate discount factors are the discount factors for Years 1 to 4 of the projections. Using a discount rate of 9.7%, the discount factors are:

The terminal date is the date at which all component and growth factors for the balance sheet and income statements become stable. Our assumption is that beyond the terminal date, everything will remain stable at the percentage projected on the terminal date. So sales will keep on growing at 6% a year till infinity, cash will stay at 15% of sales till infinity, Research and development expenses will stay at x % of sales till infinity and so on. In this case the terminal date is 2004.
We carry out the valuation calculation in two parts:
Part I – Calculating the present value of cash flows till the terminal date
In the first part we will calculate the present value of cash flows till, but not including, the terminal date. Which means that we will only use the Cashflows till 2003.

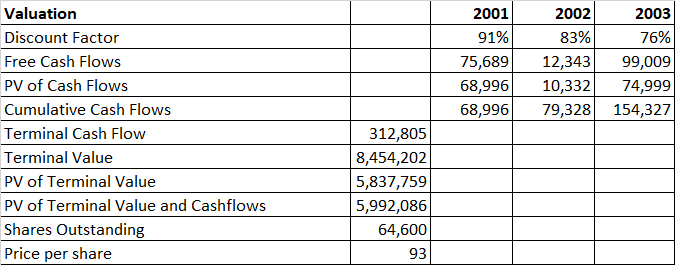
The present value of these cash flows, using the discount factor given above is as under:
The cumulative value of these cash flows is below:

So we now know the present value of Cash flows till 2003 today is 154,327.
Part II – Calculate the terminal value
In the second part of this calculation we will try and calculate the terminal value of the business in 2004.
Value an infinite sequence of cash flows, growing at a certain rate, by using the following formula:
Present Value = Cash Flow / (Discount Rate – Growth Rate).
In our case
The terminal cash flow is 312, 805
The discount rate is 9.7%
The terminal growth rate is 6%
Plugging these numbers in the above formula gives us
Terminal Value = 312,805 / (9.7% – 6.0%) = 8,454,202
Now, this terminal value has been calculated in the beginning of 2004. We still need to bring it back to today which is the beginning of 2000. We can do this by multiplying the Terminal value by the discount factor for 2004, which is .69.
Therefore the present value of the terminal value of business is .69 * 8,454,202 = 5,837,759.
Total value of the business
The total value of the business is the sum of the numbers in Part I and Part II = 5,837,759 + 154,327 = 5,992,086(Well explained with the help of the example)
Now this is what EA is worth today under our assumptions. There are 64.6 million shares outstanding. Dividing 5,992,086 by 64.6 million give us the price per share of 93 dollars . Remember that the final value figure is in 000’s and the 64.6 million figure is exact.Well that is all there is to it. But are we done?
Not quite. The most important quality of good models is that they stand the test of extremity . It would be worth while for you to now test the models, using some extreme growth assumptions and see how sensitive your valuation is to certain factors. This would also give you an idea about what drives the value of EA’s business and ultimately the price per share people are willing to pay for Electronic Arts.
Case Study Exhibits
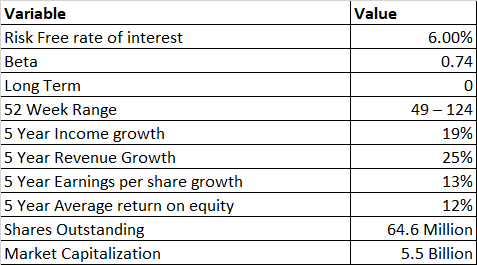
Electronic Arts – Basic Information
Balance Sheets and Income Statements for the past four years (2000-1997)
Case Study – Appendix A
10 Q’s are for quarters, 10-K’s are annual. In the US public businesses post quarterly reviews of performance namely the 10 Q (Q for quarter). On an annual basis they also file a 10 -K which is a consolidated annual review of their performances. The 10 K follow a somewhat similar format which includes
- A letter to
share holders A introduction to the business.Five year financial data- Management’s discussion and analysis of financial conditions and the results of operations
- Independent Auditor’s report
- Balance Sheets – consolidated
- Statement of Income – consolidated
- Consolidated Statement of Stock Holder’s Equity
- Consolidated Statement of Cash Flows
- Notes to Consolidated Statements
- Corporate Information