A VaR based model can be extended to frame a number of questions for commodity consumers concerned about extreme price changes. For any change in price levels of a given commodity or a change in market level risk factors you can test for a change in P&L, a change in margins and a net change in the balance sheet. We use a simple case study using crude oil to illustrate the approach.
Crude price changes impact two primary types of crude consumers.
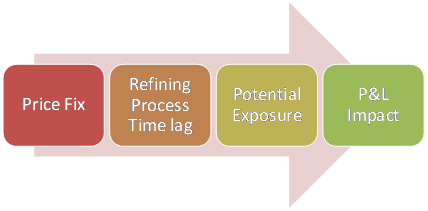
The first group includes users who use crude oil as an input and produce derivative refined petrochemical products as an output. The risk profile of this group originates from three drivers. Volatile input cost, fixed output prices (for a short or long period) and a lag between the time input products are purchased and consumed and the time it takes to for the output produced to reach to downstream customers.
The second group includes downstream users who consume refined petrochemical products and use them to produce electricity and other derivative products such as PVC, resin, synthetic fibers and fertilizer.
A dollar movement in the price of crude oil has two impacts. As prices move, prices of downstream products also move accordingly. These downstream price changes impact inventory, storage and product in the pipeline. Interestingly enough for this group the primary risk is not rising prices but declining prices. As crude prices rise, the inventory and product in storage gets marked up, adding inventory gains to the P&L statement. As prices decline, the booked gains get marked down as losses changing the direction and sign of the P&L. While inventory losses have an impact on the balance sheet as well as the P&L, the same approach can also be used to do a more detailed gross refining margin analysis. The margin analysis focuses on the impact of dollar changes in crude input on output margins and can be used to project worst case margin changes, expected margin changes as well as the probability of margin shortfall.
Margin shortfall analysis is a three step process. It also produces an inventory loss estimate as a byproduct. The three steps are:
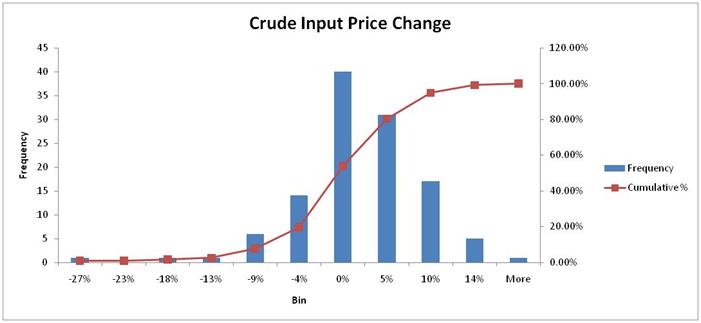
- Estimate the crude input price variation distribution
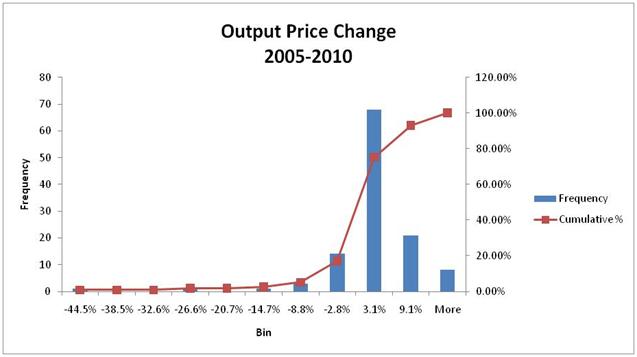
- Estimate the crude output price variation distribution
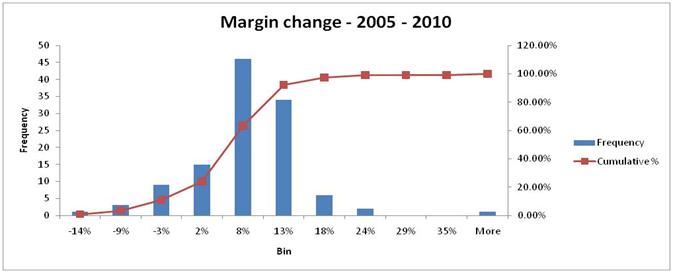
- Project the impact of 1 and 2 and estimate the margin variation distribution
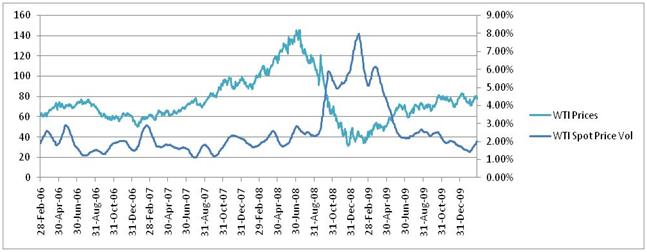
The first step is to calculate and produce the crude oil price distribution histogram you see above. It shows most likely, unlikely and extremely unlikely month on month changes in crude oil prices.
The second step is to calculate and produce the output product price distribution histogram you see below. It shows most likely, unlikely, and extremely unlikely month on month changes in output product prices.
The third and final step is to extend the input and output product price change model to create a margin shortfall model. Similar to prices a margin shortfall model tracks changes in gross refining margins and can be used to answer questions like:
- What is the probability that margins will decrease in any month over the next quarter, the next half year, or the next full year?
- What is the range of these projected reductions?
- What is the worst case reduction in any month over the next 12 months?
- What is the likely reduction in any month over the next 12 months?
- What is the probability that gross margins will shrink below the minimum profitability threshold?
- What is the probability that gross margins will turn negative?
- What is the likely expected gross margin number at current price volatility levels?
- How will this number change if volatility moves by a percentage point?
- By how much does a dollar change in crude prices change the expected margin number?
All of this would not be possible without understanding the volatility distribution model and its relationship with crude oil prices, a fairly deep understanding of the refinery industry and the composition of its margin formulae. Taleb calls this being one with the distribution.
Once the four models are ready you are now ready to tackle questions related to inventory losses or margin shortfall as illustrated in the next two figures.
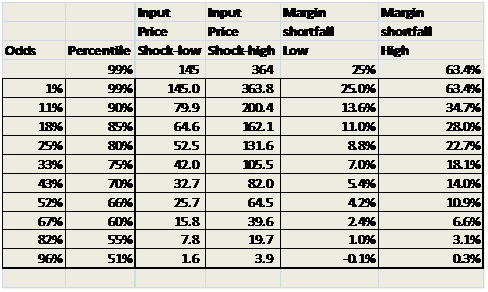
Margin shortfall analysis looks at both current and extreme volatility scenarios to calculate expected margin shortfall at different odds of occurrence. As confidence levels are lowered the odds of occurrence increase. Rather than looking at extreme cases with very low odds, it is more instructive and useful to calibrate the margin shortfall distribution to actual historical realized experience.
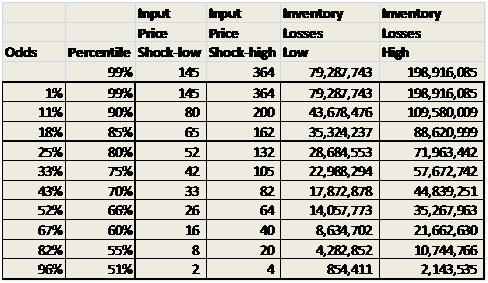
The same mechanics and process work for Inventory losses projections below.
Additional background reading.
If you are looking for additional coverage on understanding exposure to oil, its correlation with other commodities, the change in that correlation over time and possibly fair price of oil, please see the following sections
- Euro and Oil outlook – Trailing correlation between crude oil prices and Euro-USD exchange rates | Crude, Oil & Energy Insights
- Crude Oil price outlook – Is oil fairly priced now or still expensive. Or what can a barrel of oil buy – part ii | Crude, Oil & Energy Insights
- Crude Oil Trading – Trading USO | Crude, Oil & Energy Insights
- Crude Oil Price outlook – Detecting mispricing in precious metals and crude oil using trailing correlations | Crude, Oil & Energy Insights