Data Analysis. Using Excel Data Tables for Sensitivity Testing
You have built your financial model, now is the time to test it.
The objective of stress testing or sensitivity testing is to evaluate your financial model across a range of values. Sometimes we do this to test the model, more often the objective is to present a range of values. Audience are very interested in what ifs and a tabular or graphical presentation of what ifs is a great presentation tool.
For example let’s assume that you have built a simple model for a brick and mortar retail store in a shopping mall in the Middle East. Within your financial model are the following core drivers of value.
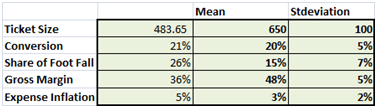
In addition to the above from a profitability and productivity point of view you also pay sales commission to your floor agents giving them an incentive to sell. Since you run a retail store your product mix includes different gross margins on different categories.
For your presentation you want to analyze the results of combining different values for each of the above drivers on the operating income of your shop. You anticipate that your audience will also focus on similar what if analysis and you want to be prepared before you go in front of them.
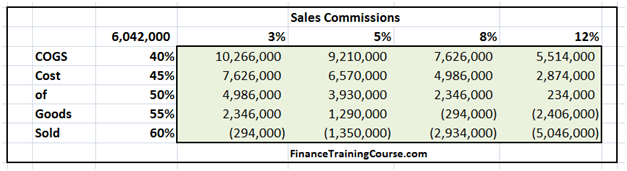
One of the first question your audience asks is the relationship between sales commissions and cost of goods sold (COGS) and the resultant income figures for about 15 different combinations of these two drivers.
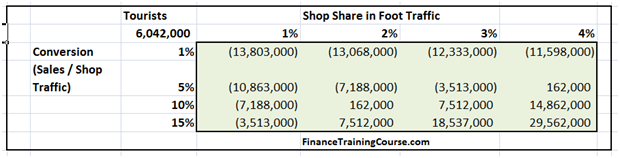
The next question deals with the sales conversion ratio and the share of your shop in the foot traffic generated by the Mall. Once again you are looking at 16 different combinations.
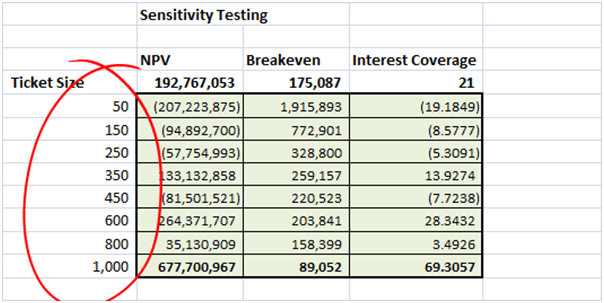
The final question looks at the impact of changing ticket sizes on valuation, breakeven & interest coverage.
There is an easier way of doing all of the above with data tables in Excel. Which is the focus of our next post.
Comments are closed.