Risk assessment. Estimating Exposure. Emirates Airline
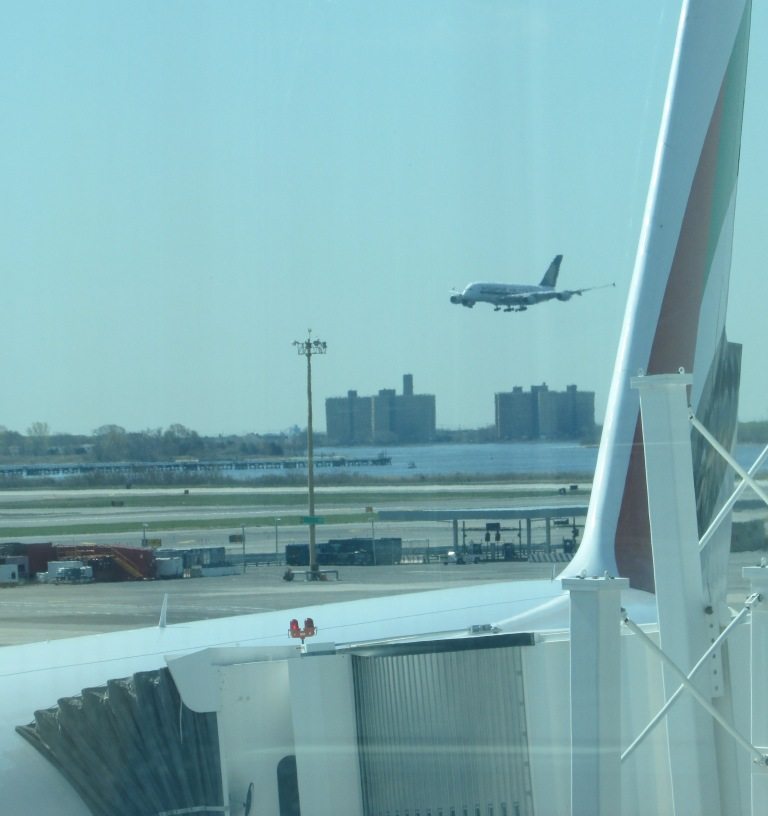
Emirates airline is a leading Middle Eastern airline known for its commitment to redefining business travel and operating the largest business and first class transit lounges in the world at Dubai Airport. Emirates flies 40 million passengers a year and its last reported financial year (2012-2013) grossed just under US$ 20 billion in annual revenues. Emirates fleet includes 200 aircrafts and 50,000 employees spread across six continents.
As air travel has rebounded and jet fuel prices have climbed Emirates has seen its profits erode despite rising revenues. Profit margins have plummeted from a high of 9.9% in 2010-2011 to 3.1% in 2012-2013. Margins have also impacted returns on shareholders’ funds, which dropped from a high of 28% in 2010-2011 to 10% in 2012-2013.
Yet Emirates decided to leave its jet fuel exposure un-hedged for the last two years. Why is that? To answer this question we have to dig a little deeper. We use a risk assessment framework to estimate the risk exposure Emirates airline is carrying to changes in jet fuel prices. We have to find out the actual amount at risk and then compare it with Emirates’ internal outlook on fuel prices.

Figure 10: Risk assessment. Fuel Expense & Consumption for Emirates. Baseline figures
We will do that using the four questions we have just identified in the preceding section. Exposure. Trend. Impact. Risk Appetite.
1. What is Emirates Airline’s Exposure?
As Emirates grows its network and passenger handling capacity, its fuel bill is also rising. Emirates consumed 7.2, 6.1 and 5.1 million tons of jet fuel in the last three financial years respectively (most recent to past). In dollar terms Emirates fuel bill was US$ 7.5, 6.6 and 5.7 billion for the same time periods.
Therefore, the most recent jet fuel exposure is 7.2 million tons. The same exposure in USD equivalent terms is US$ 7.5 billion.
2. What is the trend for Emirates Exposure?
Emirates fuel exposure is rising. While we assume there is some seasonality in fuel consumption we don’t have enough data available through public disclosure to estimate that.
However we do have price, rolling volatility & distribution data for jet fuel on a monthly basis, which is shared below:

Figure 11: Jet Fuel Price series 1990-2013

Figure 12: Jet Fuel Price Volatility 1990-2013
We can see that while prices started rising in 2009, they have stayed at their high levels since 2010. Price volatility, on the other hand, has dropped to historical lows over the same period. Average monthly historical volatility is about 9%. Recent monthly volatility has hovered around 5%.

Figure 13: Distribution of Jet Fuel price changes – histogram plot
The historical distribution of monthly price changes is slightly skewed. Prices are more likely to rise than decline as per the histogram.
3. What is Impact
The frequency count of the histogram of monthly price changes given in the table below has some interesting highlights. As of June 2013, Jet fuel prices ranged between US$ 880 – 920 per ton depending on the geographic location where you took delivery of your fuel.
| Bucket |
Frequency |
Cumulative % |
| -37.6% |
1 |
0.36% |
| -32.9% |
1 |
0.72% |
| -28.2% |
1 |
1.08% |
| -23.4% |
0 |
1.08% |
| -18.7% |
5 |
2.89% |
| -14.0% |
9 |
6.14% |
| -9.3% |
15 |
11.55% |
| -4.5% |
31 |
22.74% |
| 0.2% |
65 |
46.21% |
| 4.9% |
59 |
67.51% |
| 9.7% |
54 |
87.00% |
| 14.4% |
26 |
96.39% |
| 19.1% |
6 |
98.56% |
| 23.9% |
2 |
99.28% |
| 28.6% |
1 |
99.64% |
| 33.3% |
0 |
99.64% |
| More |
1 |
100.00% |
Figure 14: Distribution of Jet Fuel price changes – frequency table
The question we want to ask is: “What is the most likely price movement that we are likely to witness in the future?” While we are at it, we would also like to make an educated guess about the extreme price movements that we may see over our projection time horizon.
The historical distribution in the table above gives us a range of price movements and their historical likelihood. We conveniently assume (for now) that historical price changes are reasonable predictors of future price changes.
Using the two tools (i.e. the histogram chart and the frequency table) we can see that the probability of a price rise is significantly higher than a price decline. Based on the cumulative probability table and plot the probability of a price decline is 22% and change. The probability of a price rise is 77%.
On the extreme movement front there is 3.6% chance of seeing a price rise of greater than 9.7% in any given month. The odds translate to one such move every 25 months.
So if prices rise by over 10% in any given month, what is the amount Emirates airline will have to pay in excess of its usual fuel bill in that month?
More importantly if prices rise are they likely to immediately come down or will they stay up there in the stratosphere? If they rise and Emirates can somehow pass the increase on to its consumers, how deeply will that action impact demand and capacity utilization? What about tickets that have been purchased months in advance and paid for by corporate customers? What proportion of Emirates business is advanced booking?
These are all important questions that need to be factored into our impact assessment model. But for now we only need to answer the first question. If price rise by 10% and stay there, what will be the net impact on Emirates fuel bill?
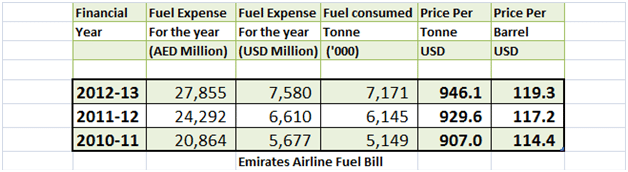
Figure 15: Fuel Expense & Consumption for Emirates
Based on the 2012-2013 figures, Emirates would spend an additional US$758 million on its fuel bill assuming the price rise has no impact on passenger demand and capacity utilization.
We initially assume a linear relationship, which implies that if prices rise by 15% the fuel bill will also rise by 15%. Later on in our jet fuel hedging case study we build a non-linear model, which will take into consideration additional factors, some of which are identified in the questions above.
4. What is Emirates’ risk appetite?
This question is a little tricky. If we work for a financial institution or a bank we evaluate market exposures in terms of capital adequacy & capital allocation. Banking boards and regulator are comfortable with these two measures and no new context and background is required to appreciate the results presented.
But for non-banking Boards capital allocations & capital adequacy are meaningless measures. These two measures do not translate well at the senior management or board level. What works though are profitability, margin & probability of shortfall. While we won’t touch on all three in this chapter we will use profitability and margin to answer the question for Emirates airline.
Can Emirates afford a possible price shock of US$750 million and change?
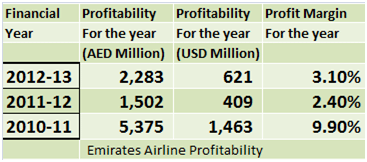
Figure 16: Emirates profitability and profit margins
With US$ 621 million in profitability a US$ 750 million price shock would push Emirates bottom line into the red zone. While a 10% price shock will only add 4.5% to the operating cost base of the airline, this additional increase will vaporize what little profitability Emirates has recorded.
A board member can easily come back and state that there is only a small chance of this event being realized. Historical data indicates that the likelihood of a 10% increase is 3.6%. Is there a need to counter this argument?
The same table that gives us 3.6% probability for an increase larger than 10%, also shows us that the probability of a greater than 5% increase is around 32%. These are 1 in 3-month odds. A 5% increase adds 380 million in excess fuel charges and keeping everything else constant accounts for over 61% of Emirates’ 2012-13 profitability. Now the odds and the projected loss are much more real and immediate.
Yet as per Emirates financial disclosure we see that in their assessment they are still better off leaving the fuel purchase and the associated price risk un-hedged.
Before you move forward, spend a little time in thinking about the argument in favor as well against fuel hedging. Emirates has been in the flying business for over two decades. They are not new to the fuel hedging game. If they see the same data we see and think hedging is not going to add value what is it that we are missing in our analysis?
5. Conclusions from the Emirates example
A logistics business covers a wide range of services. From airlines that carry passengers, freight and cargo to bulk carriers that transport containers of finished goods as well as raw ore and commodities. From small distributors that ensure delivery of your products to retail stores to large national fleets that are the backbones of just-in-time inventory systems. They are all reliant on one crucial, volatile commodity. Fuel.
Fuel expenses today represent between 35% – 40% of total operating expenses for the logistics industry. Fuel is a commodity, which is volatile and in many instances very difficult to hedge perfectly. If you were responsible for managing the risk in this business where would you start? What kind of questions will your Board ask? How would you go about answering them?
After reviewing the Emirates example some of the questions should be derived by common sense.
- Oil price volatility
- Exchange rate volatility
- Fuel price volatility
- Relationship between oil and fuel prices
- Total input price volatility – any additional correlations
- Demand forecasting and price elasticity
- Hedging transaction costs
- Purchase, payment and consumption lags
The above factors don’t work in isolation or exact sequence. If they did we would have a simple linear model.

Figure 17: Risk assessment. The cascading waterfall impact of one risk factor on P&L
A reasonable model considers the impact of complex interactions between these factors. Some interactions cannot be modeled and are handled outside of the model, which implies that our results and conclusions are imperfect. They are qualified or subject to limitations.
As model builders we may have faith in our conclusions, but Boards need to understand that our recommendations are based on imperfect assumptions and relationships that may not hold under times of stress.
So what does Emirates sees that we are not seeing. To answer this question we have to revisit the jet fuel price and volatility graphs presented earlier. The first graph shows price plot while the second shows rolling volatility.
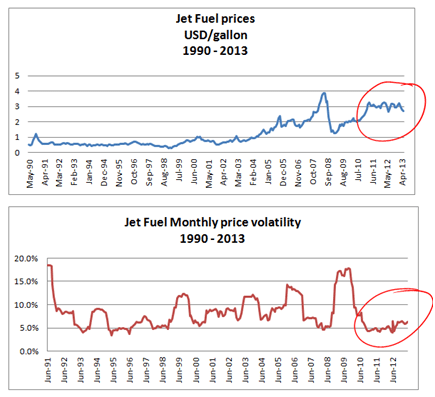
Figure 18: Jet Fuel prices and volatilities – 1990 to 2013
Emirates has two concerns.
The first is that jet fuel prices are at historical highs. In their opinion at these levels the likelihood of prices going up is low. There is a much higher chance that prices will decline. If Emirates hedges its jet fuel exposure at current prices, fuel cost will be locked in at these levels which would be especially painful if fuel prices were to collapse.
Emirates is not the only airline to feel this way. Post the collapse of crude oil price in 2008, a number of regional airlines took a bath when their hedging strategies backfired by locking them in at peak price levels of US$ 130 a barrel while the market tanked to US$ 33 a barrel.
The second concern is volatility. While prices are at historical highs, volatility is at historical lows. The question is when (not if) volatility rises, will prices rise or decline? Emirates apparently feels that with the rise in volatility they are more likely to decline.
Given the above context Emirates believes that till the picture about jet fuel clears up, they would be better off by partially passing on the cost increase to customers via fuel surcharges and adjustments. Such an approach is more flexible given the current context and allows Emirates the option to hedge its exposure when prices can be locked at lower levels.
Hence Emirates’ decision to leave their jet fuel exposure un-hedged in 2012-2013.
Comments are closed.