A Synthetic Credit Portfolio trader, Bruno Iksil, was given the title of the “London Whale” in the April 6, 2012 issue of the Wall Street Journal and Bloomberg. (Hurtado) This case study focuses on the reasons for that article and the series of derivative transactions (involving credit default swaps) which cost JPMorgan Chase & Co. more than $6.2 billion.
It is not a single event that brings about catastrophic loss. Just as investigative studies on historical air crashes reveal, financial loss events that are now part of business school case studies too, are usually the cumulative results of many contributing factors. Wrong decisions, poor choices, lapses in judgment, not understanding or accepting limitations, faulty controls and oversight, conflicting interests as well as external events beyond company control, all contribute to bringing about a calamitous news breaking event.
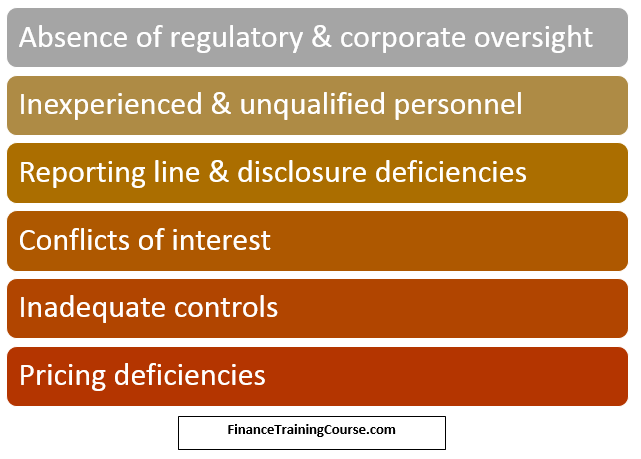
In the case of the JP Morgan Chase London Whale CIO synthetic credit portfolio (SCP) debacle, some of the contributing factors were:
Overview
To briefly recap the London Whale debacle before moving to the contributing factors:
JPM’s CIO was responsible for investing the excess cash of the bank. The main investment was in high quality income bearing securities such as whole loans, mortgage backed securities, corporate securities, sovereign securities, asset backed securities, etc. The synthetic credit portfolio (SCP) was constructed in 2007 in order to protect the bank against adverse credit scenarios such as widening credit spreads during the financial crisis.
The synthetic credit portfolio positions were based on standardized credit default swap (CDS) indices. The positions were the purchase and sale of protection against credit events of the corporate issuers tied to the basket of CDS included in the indices. If the protection was bought (short risk positions) the cash flows were as follows:
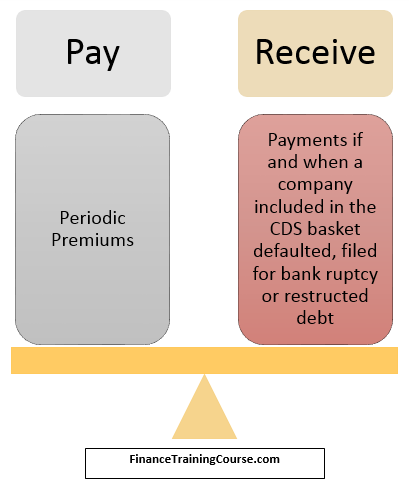
If the protection was sold (long risk positions) the opposite would be true – in exchange for receiving premiums, the CIO would have to pay protection if a credit event were to occur in the concerned index. Positions were in the different CDS indices & tranches (CDX, iTraxx; Investment grade and High Yield).
While the SCP performed well in 2009 netting the CIO $1 billion, the notional size of its synthetic portfolio increased significantly from $4 billion to $51 billion during 2011, in light of the European default crisis. In December 2011, following a more positive outlook for the economy, CIO was asked to reduce the exposure of SCP and the risk weighted assets of the CIO.
Given the loss estimate of $500 million for unwinding synthetic credit portfolio positions by selling them off due to current market conditions, loss of premium & execution costs, and following a chance win of $400 million on a speculative trade, the CIO instead opted to reduce RWA by implementing a hedging strategy using a portfolio of options, in line with the Comprehensive Risk Measure (CRM) of Basel 2.5, and a new VAR model to calculate the risk & limits.
The new model significantly reduced risk numbers, allowing the traders to implement the options portfolio strategy. However, the strategy did not work as expected, given that the market environment and correlation between positions were not in line with traders’ expectations, and instead resulted in trading losses that continued accumulating. CIO traders tried to defend their existing positions by further growing their portfolios with huge trades to support market prices. Given the illiquidity of the markets, however, the CIO became significant market movers in these securities, thus reducing their ability to exit the markets without being impacted negatively by it.
For the first quarter financial results, CIO traders had tried to downplay mark to market losses by setting marks that were at significant variance to the midpoints of dealer quotes in order to show a better than actual MTM picture on the books. This eventually led to a restatement of the first quarter earnings and refiling of financial results. Mark to market losses grew to $5.8 billion as of 30th June 2012.
Absence of regulatory and corporate oversight
The CIO was not a client facing unit of the bank. For this reason, it did not receive the same scrutiny as other portfolios would receive in terms of regulatory compliance and corporate oversight.
There were no separate portfolio limits based on market values or asset type limits set for the synthetic credit portfolio (SCP) and there was no daily reporting that was specific for the SCP to senior management. In addition, Risk committee meetings were held infrequently and did not seem to have any specific charter or mandate and were rarely attended by other than CIO personnel.
Due to the lack of oversight CIO traders were able to engage in speculative and risky derivative trades which were not in line with the CIO’s traditional investment strategy of long term investments with credit derivatives for hedging purposes only.
Regulatory oversight too was lacking. The Office of the Comptroller of Currency did not follow up on previous concerns raised regarding the transparency of the CIO’s investment decisions. They also did not raise the alarm when the update to a new VaR model resulted in risk numbers that were 50% lower than prior numbers, being unaware that a new model was being used.
London Whale – Inexperienced and unqualified personnel – CIO CRO
Risk management specifically for the credit derivatives portfolio of the CIO unit does not appear to have been a priority until after the size of the synthetic credit portfolio had already become unwieldy in January 2012. The task force assigned by JP Morgan Chase Bank to investigate CIO Losses reported that the risks of the trading strategies were neither adequately analyzed nor questioned prior to their implementation.
Prior to February 2012 the risk management function was overseen by Peter Weiland chief market risk officer who reported directly to the bank’s CRO, Barry Zubrow. Mr. Zubrow, as the JPM task force report admits, did not take adequate steps to strengthen the risk and control framework for the CIO, while Mr. Weiland did not have the necessary clout to withstand the pressures from the traders and CIO management. Further, the CIO Risk team was unstaffed and did not have proper direction.
In February 2012, after the SCP had already gotten out of hand, Irv Goldman was appointed as the CIO’s first CRO. For Mr. Goldman, this was his first risk management position in his career which mainly had a capital markets focus. He would not have had the necessary experience to adequately address the deteriorating risk position of SCP during the period February 2012 to May 2012 as he was still learning the ropes of his new position.
With respect to corporate governance, Mr. Goldman’s appointment is itself a matter of controversy considering his lack of risk management experience, his appointed by his brother in law, Zubrow, his contentious past, having been fired from a previous position at Cantor Fitzgerald for insider trading in 2007.
Quantitative analyst – VaR model for the synthetic credit portfolio
The head of the European Equity and Credit unit of the International Investments Office, Javier Martin-Artajo and his Relative Value Strategic Trading head, Bruno Iksil (the London Whale) came up with a strategy to hedge the existing portfolio with a portfolio of options on the credit indices, so as to reduce the losses as well as the associated RWA of the synthetic credit portfolio.
However, at that time, the SCP was already in breach of the VaR limits set for the portfolio. The new strategy would further increase the size of the breach as the overall exposure of the portfolio would increase with its implementation.
A solution was to implement a new VaR model for setting VaR limits. The new model would also influence the amount of risk weighted assets that were being calculated for the CIO. The premise for implementing a new model was that the existing one was too conservative which lead to an overstatement of risk thus resulting in limit breaches. This new VaR model was researched and built by the CIO itself specifically by Patrick Hagan, a front office quant, who had never before built or implemented a VaR model.
While the model was built after a number of months of research, it had mathematical & operational flaws which were highlighted by the bank’s Model Risk and Development Office. There were a number of additional issues that came to light much later. These included:
- Manual updates required in EXCEL spreadsheets
- Lowered volatility for illiquid securities based on the assumption that prices for days on which trades did not occur would be the same as the price when last traded
- Coding errors in the calculation of hazard rates and correlation estimates
- Use of a wrong Uniform Rate option in the built in analytics suite instead of the Gaussian Copula model option required under Basel 2.5
The Model Risk and Development Office required that the model be automated and that illiquid positions receive increased monitoring.
However, instead of a truly independent review of the model by the model review group and the standard parallel run of the old and new model during a probationary review period, the new model was implemented under pressure & without resolving the issues highlighted in it. Further, the analytics suite that the model utilized remained untested as of the date of implementation. The new model produced results that were as much as 50% lower than the existing model which did not raise questions of its appropriateness or accuracy at that time.
Reporting line & disclosure deficiencies
Regular risk reporting of the CIO’s risk, prior to February 2012 was made officially to the bank’s CRO rather than to Ina Drew. The latter received reports being head of the CIO but was not the direct official reporting line.
Even after the appointment of the CRO, only aggregate CIO portfolio risk numbers were provided to Ina Drew. She still did not receive separate numbers for the synthetic credit portfolio positions.
There was no segregation or independent evaluation of the risk of the SCP by the bank wide risk management team. The bank’s risk management team depended on the risk numbers reported by the CIO’s risk team.
The CIO team was selective in communicating their strategy and portfolio position of the SCP to JP Morgan senior management in month end business reviewing meetings. In the meeting held in February 2012, for example, they mentioned that they were working on reducing RWA as tasked by the bank, but they failed to mention that their strategy required them to increase overall portfolio exposure and that the SCP was already making significant losses.
In addition to this in April 2012, senior management was misinformed about the potential losses and market recovery of the SCP positions. The analysis used to make the assessment was based on a Monte Carlo model that produced more favorable results showing losses between $-150 million to $250 million as compared to economic scenario analysis models that showed losses in the range of $750 million to $1.925 million. Further, the bank’s senior management was informed that the losses were temporary and would resolve once the market behaved as per expectations.
Conflicts of interest
Ina Drew was the reporting line for both the investment and risk management teams. These teams would have conflicting interests, i.e. between optimizing returns from the investments for the trading team against reducing the risk for the risk management team.
The mandates given to the SCP team enhanced this conflict. CIO was tasked to reduce its RWA given the Basel 2.5 deadline. It focused on SCP because the nature of its investments made it RWA expensive and because of the bank’s bullish view of the credit markets.
This came at the cost of trading losses given market conditions as well as from inadequate protection as expired protection was not replaced. While traders were asked to reduce RWA they were also asked to keep an eye on profit and loss impact of their trades by the head of the CIO.
There was no indication from the bank as to the level of tolerance for the trading losses including whether or not traders would be penalized for losing money when unwinding positions to meet the reduced RWA objective. Therefore there was nothing to benchmark the growing risk appetite of the traders in the light of more favorable risk limits following a revision to the VaR model nor their determination to continue to trade to defend existing positions so as to minimize the negative impact on PNL.
PNL was negatively impacted by mark to market losses of their existing portfolio position as the portfolio was not behaving as it was designed. Short and long positions in the portfolio were meant to neutralize the Credit Basis Point Value of the portfolio for credit moves. Instead, the long positions in investment grade credit indices were losing money while short positions in high yield indices were not generating as much return to cover these losses.
In addition, as the securities in the SCP were fairly illiquid and because the CIO was a significant part of the market any attempt to sell would cause prices to dip thus worsening the position.
The focus of the SCP seems to have blurred from the original motivation of setting up the SCP which was to hedge the credit risk of the long term income bearing portfolio of the CIO. Traders’ focus had shifted from hedging to profit making, particularly following the implementation of the revised VaR model. In order to reduce the negative impact on PNL, the SCP team started making speculative high risk trades as well as defending their positions against adverse price movements by buying and growing (instead of reducing) the portfolio.
An additional conflict was that the new VaR model was constructed by a quantitative analyst whose direct reporting head was the CIO head trader responsible for the trades. The timeline and the depth of research and resources expended for construction and implementation were dictated by the demands of the traders rather than the standard practice of a thorough review and testing of the model.
Inadequate controls
VaR works well for liquid markets because of the existence of a credible price history- it may not be appropriate for illiquid markets with numbered institutional investors where price history is more fragmented and less frequent. Credit Spread Basis Point value and Credit Spreading Widening inform of the sensitivity to the portfolio to changes in the credit spread. The former is appropriate for small moves in credit spread but does not account for the convexity present in more complex portfolios.
Limits were not granular enough, being reported only at the aggregate CIO portfolio level instead of also separately for the SCP. Further, there were no limits on portfolio composition or asset concentration or by risk factor as well as no limits on the actual market value of the SCP.
In addition, these limits were not hard limits, i.e. they did not automatically lead to action by the CIO to reduce risk, and from a post mortem of the debacle, do not appear to have been taken seriously most of the time. There were over 300 hundred breaches during the early months of 2012 and the SCP’s losses steadily built up as these were ignored. Most of the risk metric breaches were not fast tracked to the CIO head and as mentioned earlier, separate risk numbers, exposure or daily trade data for the SCP were not communicated to Ina Drew. Further, in some instances instead of addressing the increased risk, limits were inflated so that the trades/ positions would no longer be in breach.
While a new VaR model was implemented, limits related to the VAR metric were not reassessed until May 2012 and the same limits structure that was set based on the existing model (which produced higher VaR numbers and thus limits), was allowed to continue.
Pricing deficiencies
Due in part to the illiquid nature of the indices, traders had too much flexibility when setting prices to be used as marks for the mark to market process. Highly subjective judgment and inconsistent selection processes were used to determine the most favorable marks. Instead of averaging the midpoints of bid ask prices from several different dealers with significant trades in the instruments, only those that were favorable were chosen by the traders to set the prices. As long as these were within its allowable pricing thresholds, the Valuation Control Group (VCG) of the CIO deemed that they were okay to use.
However, no one questioned the validity of the VCG’s assessment given that:
- JP Morgan Chase Bank’s internal audit had already identified that the VCG was using untested and poorly documented models and setting weak allowable pricing thresholds
- The marks set by the CIO often were at significant variance to the mid-point quotes from the dealer, thus not representing good faith estimates of the prices.
JP Morgan Chase & Co. (an Investment Banking firm)’s Chief Investment Office in London tried to sidestep capital regulation laws of risk management by fulfilling the bare minimums of regulatory requirements. Traders were given the incentive to score big, so instead of focusing on simplicity, traders focused on the complexities of derivative markets. Chief Investment Office did everything including misguiding the authorities by placing trust upon untested models which showed less risk (which in turn provided freehand for traders to try to exploit riskier options) and ignoring all the danger signals provided by the stress testing.
The simplest and fastest way to cut risk was to sell positions but it would have had cost them $516 million. Under Drew’s direction, the London traders embarked, instead, on a strategy to reduce the appearance of risk for regulatory purposes. They also hedged investments with securities that moved in the opposite direction. The London-based traders amassed a large, complex financial portfolio (consisting significantly of Credit Default Swaps) in the hope that doing so would help the bank avoid the loss.
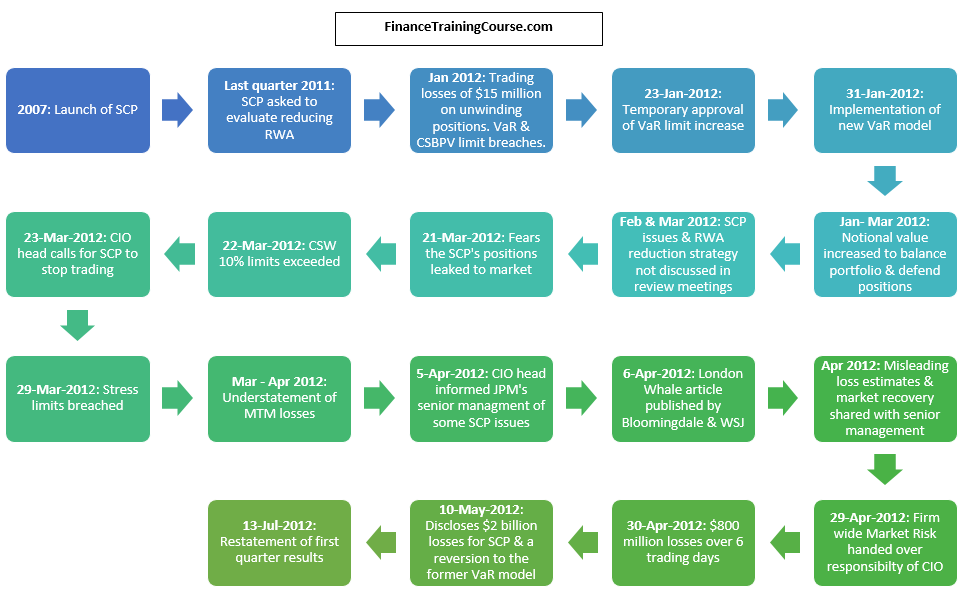
London Whale – Timeline of Events
The traders started to substantially increase their investment-grade long positions. By the end of January, the firm booked year-to-date, mark-to-market losses of about $100 million. Additionally, the bank began using a new formula for value at risk that cut Mr. Iksil’s estimated losses by about half. The bank eventually conceded that the new VaR standard was seriously flawed (JP Morgan), but not before the change emboldened traders to increase the size of the London Whale bet, which resulted in doubling down after a loss with bigger and bigger bets; eventually leading to even greater losses. Mark-to-market losses grew to $169 million by the end of February 2012.
By March 23, 2012, the traders had added significant long positions to the Synthetic Credit Portfolio; after assessing the situation, the Chief Investment Office ordered the suspension of trading in the portfolio. Even after that, the estimated mark-to-market losses continued to grow throughout the end of March and the year-to-date losses reported by the traders totaled at about $400 million through March 29, 2012.
However, on March 30, 2012, the reported estimation of mark-to-market loss was at $138 million only. That was later confirmed as deception by Mr. Martin-Artajo, who directed Mr. Iksil to use the “best” possible prices. A separate spreadsheet was still kept by Mr. Iksil which showed the estimate losses at over $400 million.
The Chief Investment Office on April 5, 2012, sent an e-mail to the JP Morgan Operating Committee making them aware of an article that would be published in the Wall Street Journal and Bloomberg. The Office also assured them that the situation was under control and that the Synthetic Credit Portfolio was generally “balanced,” that the market was currently dislocated, and that the mark-to-market losses were temporary and manageable. That prompted Mr. Dimon, the company’s CEO to declare the Synthetic Credit Portfolio a “tempest in a teapot” and Mr. Braunstein (Chief Financial Officer) to further state that the Firm was “very comfortable” with its positions as mark-to-market prices in the Synthetic Credit Portfolio would “mean revert” (Kopecki ).
It was further revealed that on the evening of April 7, 2012, Mr. Grout formulated a loss estimate by constructing numerous loss scenarios. He evaluated how those scenarios would impact the Synthetic Credit Portfolio’s positions. In that way, he generated a number of probability-weighted profit-and-loss estimates for the second quarter; the estimates ranged from losses of $750 million to gains of $1.925 billion. However, the Mr. Martin-Artajo felt these scenarios were very unrealistic and thus directed that trader to simply run a “Monte Carlo” simulation to determine the potential losses for the second quarter, against Mr. Grout’s recommendation. Nevertheless, he performed the requested analysis and came to a loss estimate of -$150 million to +$250 million which was provided to senior management.
It was not until after the Earnings Meeting – on April 13, 2012 – that the company realized the predictions were all wrong and “mean revert” was not going to happen. Messrs. Dimon, Braunstein, Hogan and Ms. Drew commissioned a thorough review of the Synthetic Credit Portfolio, conducted by personnel outside of the Chief Investment Office, in order to better understand the losses it was experiencing and to know whether the Synthetic Credit Portfolio was properly managed.
On April 26, 2012, Mr. Hogan directed senior members of firm-wide Market Risk to commence a position-by-position review of the Synthetic Credit Portfolio and eventually to take over the responsibility of the Synthetic Credit Portfolio. (JP Morgan) The firm’s own review showed that the Synthetic Credit Portfolio was not protected against various market scenarios. In addition, they found that the market’s knowledge of the positions resulted in investors at other banks and hedge funds that were trading with JPMorgan to take advantage of the situation so that a liquidity risk reduction was not possible.
Following the firm’s audit report, on May 10, 2012, the firm disclosed that there were significant problems with the trading strategy for the Synthetic Credit Portfolio and the strategy was “flawed, complex, poorly reviewed, poorly executed, and poorly monitored.” (JP Morgan) The firm disclosed that the Synthetic Credit Portfolio had incurred slightly more than $2 billion in mark-to-market losses up to that point in the second quarter, with the possibility of additional future losses and volatility.
Accordingly, on July 13, 2012, the firm restated its first-quarter net income after lowering it by $459 million. At the same time, the firm that the cumulative year-to-date losses through June 30, 2012, had grown to approximately $5.8 billion.
In this case, the bank was not alone at fault. The regulators overseeing the bank at the Treasury Department’s Office of the Comptroller of the Currency didn’t detect the risk accumulating in the Chief Investment Office’s synthetic-credit portfolio when it increased to a hundred and fifty-seven billion dollars, in the first quarter of 2012. The regulators should also have taken note when the risk profile of the Synthetic Credit Portfolio suddenly improved by fifty percent.
The penalties
Following the incidents, the UK and U.S. Attorney’s Office opened an official investigation into the matter. It was investigated whether the traders at JPMorgan’s Chief Investment Office in London intentionally inflated the value of their portfolio to conceal losses. Federal officials charged the responsible persons on five counts, including securities fraud, conspiracy, filing false books and records, wire fraud and making false filings with the U.S. Securities and Exchange Commission. (Hurtado)
The bank agreed in September 2013 to pay $920 million to resolve related U.S. and U.K. probes into its internal controls and handling of the trades, which inflicted at least $6.2 billion in losses to the bank. The selling cited by the CFTC was a “manipulative device” that disregarded consequences to the broader market. And further, on October 16, 2013, the bank agreed to a $100 million settlement with the Commodity Futures Trading Commission, which found that it had deployed a reckless trading strategy. Thus the total amount of fines exceeded $1 billion (Brush).
London Whale – Summary of Events
| Dec-11
51 billion in net notional positions of credit index and tranche position |
Jan-12
mark-to-market losses of about $100 million. Created the new VaR model |
Feb-12
mark-to-market losses of about $169 million |
29-Mar-12
mark-to-market losses of about $400 million |
30-Mar-12
mark-to-market losses of about $138 million. Spread Sheet Error. |
| 5-Apr-12
Chief Financial Officer sends the e-mail |
6-Apr-12
The London Whale Article |
6-Apr-12
Grout forced to go back on his analysis |
13-Apr-12
the Earnings Meeting |
26-Apr-12
Firm-wide Market Risk commences |
| 10-May-12
disclosed $2 billion in mark-to-market losses |
13-Jul-12
disclosed $5.8 billion in mark-to-market losses |
16-Jan-13
Report of JPMorgan Chase & Co. |
Sep-13
$920 million fine |
16-Oct-13
$100 million fine |
Results of the Crises
In JP Morgan’s Chief Investment Office, new and more robust committee structures have been instituted. The new management has enhanced its key business processes and reporting and a revision of basic policies and procedures with respect to valuation and price verification was done. The firm has also mandated a self-assessment of the Risk function within each line of business which includes the firm conducting a spot check of significant drivers of the firm’s VaR (JP Morgan)
References
- “Ex-JPMorgan Employees Indicted Over $6.2 Billion Loss.” Bloomberg.com. Bloomberg.
- JPMorgan Chase & Co. Management Task Force Regarding 2012 CIO Losses. Rep. N.p.: n.p., January 16, 2013.
- “JPMorgan Loses $2 Billion in Chief Investment Office.” Bloomberg.com. Bloomberg.
- “JPMorgan Senate Report Says Bank Misled Investors, Regulators To Hide Massive ‘Whale’ Losses.” Golden Age of Gaia.
- “JPMorgan to Pay $100 Million Fine on CFTC London Whale Claim.” Bloomberg.com. Bloomberg.
- Report of JPMorgan Chase & Co. Management Task Force Regarding 2012 CIO Losses – Jan 16, 2013
- The London Whale Dystopia – A case study of JP Morgan’s 2012 CIO disaster – Hill & Stanley Jun 2015