Let’s begin with a simple question. When it comes to managing money, how much impact do small mistakes or decisions make? Minor oversights like fund management fees or taxes? After all how much difference does 2% a year in fund management charges make? What’s the big deal about tax adjusted savings rates and deferred taxes? How much is the impact of taxes on retirement savings? How much is the impact of fund management fees on retirement savings?
We ask these questions and more every time we discuss the concept of portfolio management with our students for the first time. When you delegate managing your investments to a third party how much are you actually paying over the long term? Is it really worthwhile for you to understand how investments portfolios are constructed and to take charge of your own investment plan?
The retirement savings and investment cycle
To answer the question correctly we first have to identify the time period and the investment horizon involved. Let’s make an assumption and start with forty years. Why forty years? A typical professional may begin work at the age of 23-24 and health permitting will continue to work for a living till he or she turns 63-65. That gives us forty years.
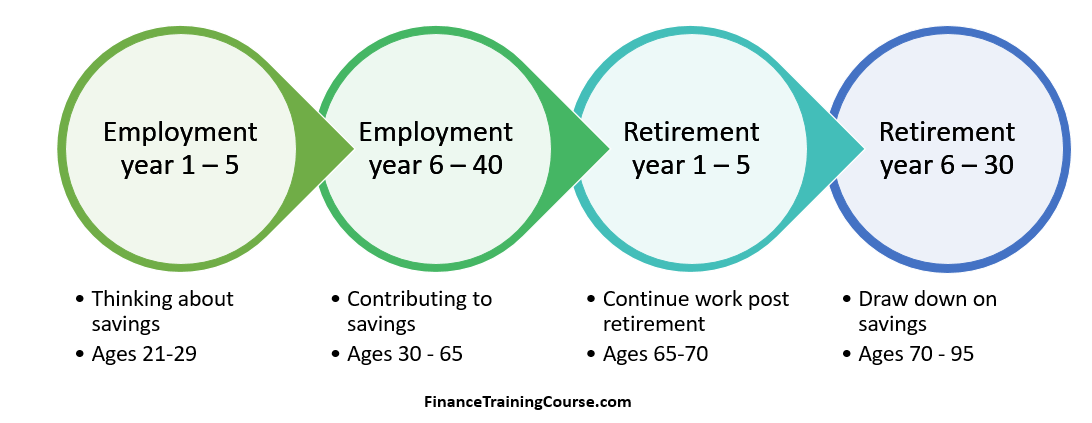
The actual personal investment cycle runs for fifty five to seventy years depending on when you start working or saving as well as when you start distributing and using proceeds at full retirement. Most individuals and families start thinking about investing formally for retirement by the time they reach the age of thirty, they start distributing by the time they reach age sixty five.
For the first thirty to forty years, we invest and build up our retirement portfolios. This is when we and our employers contribute on our behalf into our retirement savings. As long as we invest without being too greedy or ambitious, the nest egg grows. The build up happens as a combination of contribution and returns increase the value of our retirement savings account every year.
During the next fifteen to thirty years, we take our savings out and convert them into a formal payment plan. There are many ways of doing this. Selectively maturing a part of the portfolio every few months or quarter to cover expenses and payments. Buying an annuity product from a bank or life insurance company. Moving funds from riskier assets into less riskier bonds or special savings accounts. The desired result is a payment plan that transforms our savings into monthly or quarterly payments allowing us to live off our savings. Depending on our ability and skills as a portfolio manager we could either entrust an insurance company or bank or do the math every year or do the execution ourselves.
Thirty to forty years of active investing followed by twenty to thirty years of distributions depending on our employment contract and our lifespan. That is the savings and distributions cycle.
Most professionals won’t end up working for the full forty years or live for the next thirty. Health, personal choices, morbidity and health intervene. For the purpose of answering the question posed above we have to assume a value for the number of years we invested as well as the number of years we lived off our savings. Based on population averages we assume that contribution and investment phase is 35 years. And the distributions occur over the next 20 years. A total span of 55 years once from the point we start working at age 25.
Impact of taxes and fees on retirement savings
The two key questions we are concerned with are the impact of fund management fees and taxes on the growth of our funds over this cycle. Fund management fees range from 0.5% of assets under management to 2.5%. Tax rates vary from 35% on regular income to 10% on dividends and returns to zero percent on amounts contributed to savings account or amounts invested in long term assets.
One measure is the absolute size of the fund reached on retirement based on our investment strategy. The second measure is the difference between the monthly payments generated by the final fund size based as a result of our choices. Two questions with two simple metrics.
- Size of retirement nest egg.
- Amount of monthly retirement savings.
Impact of taxes and fees on both over 35 years.
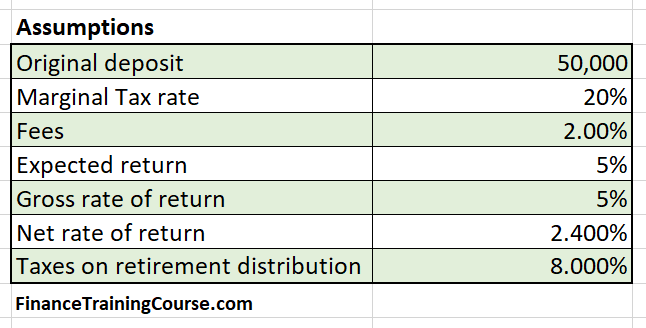
We answer the question using a simplified but illustrative way. Let’s assume we start off with a pool of US$ 50,000 at age thirty. We want to maximize the growth of this pool over thirty five years. We assume:
We are interested in answering the following three questions.
- How big is the difference in the final endowment available to us at retirement if we plan our taxes properly and minimize their incidence.
- How big is the difference if we minimize fund management fees
- How big is the difference in the final monthly payments on our retirement annuities as a result of the choices made in (1) and (2) above.
The two graphs below try and answer the three questions across five different compounded return scenarios.
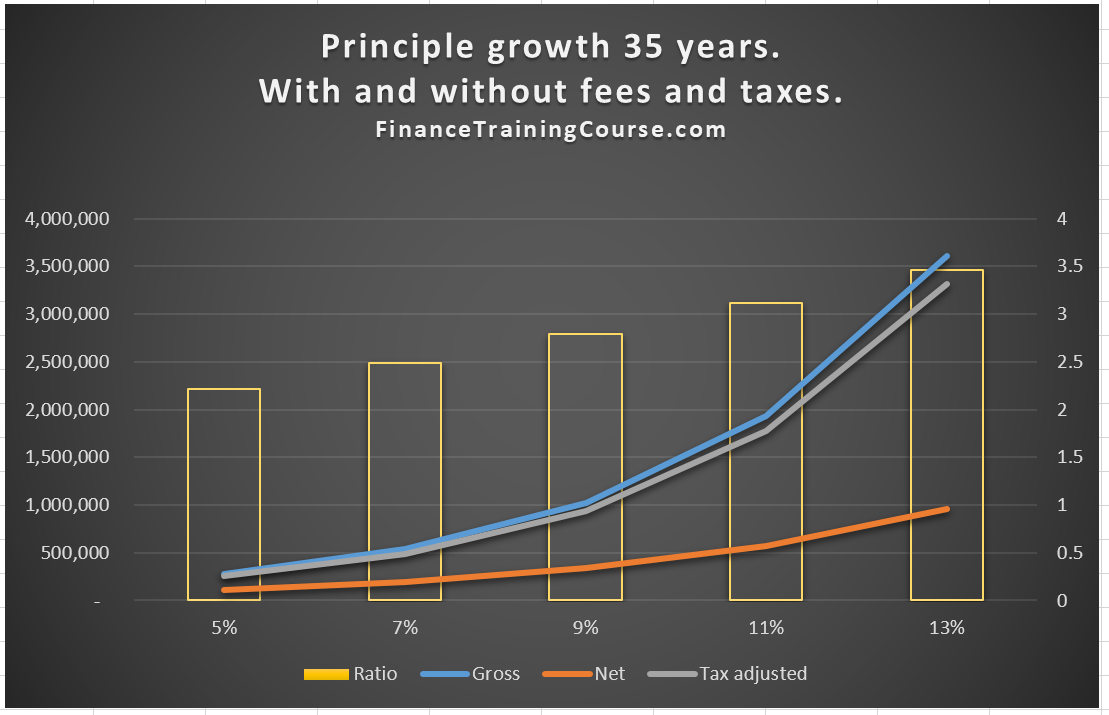
The crude answer is as much as 3.5 times at higher rates of return and as low as twice as much at the lower end of returns. The graph above shows the growth in endowment next of taxes and fees over 35 years across 5 different return (interest rates) scenarios. The bars show the difference in the size of nest egg after adjusting for taxes on distribution 35 years down the road.
The gross figure is the size of the retirement account as it grows tax free. The net figure is the amount reduced by annual taxes and fund management charges. The tax adjusted amount is the gross amount taxed on distribution post retirement at the applicable post retirement tax rate.
We can clearly see that both tax efficiency and fund management fees add up over the long term. Their impact may not be visible in initial years or at lower rates of returns but it becomes clear as the account ages and returns begin to improve.
The graph below shows the size of the monthly annuity payment when the same endowment is converted at the time of distributions. We assume that the nest egg is converted into a twenty year retirement annuity at the time of retirement and that monthly payments are taxed at a lower tax rate of 8%. Once again we see the same ratio. 3.5 times at higher rates of return. 2 times at lower rates of return. Higher the rates of return the bigger the impact of taxes.
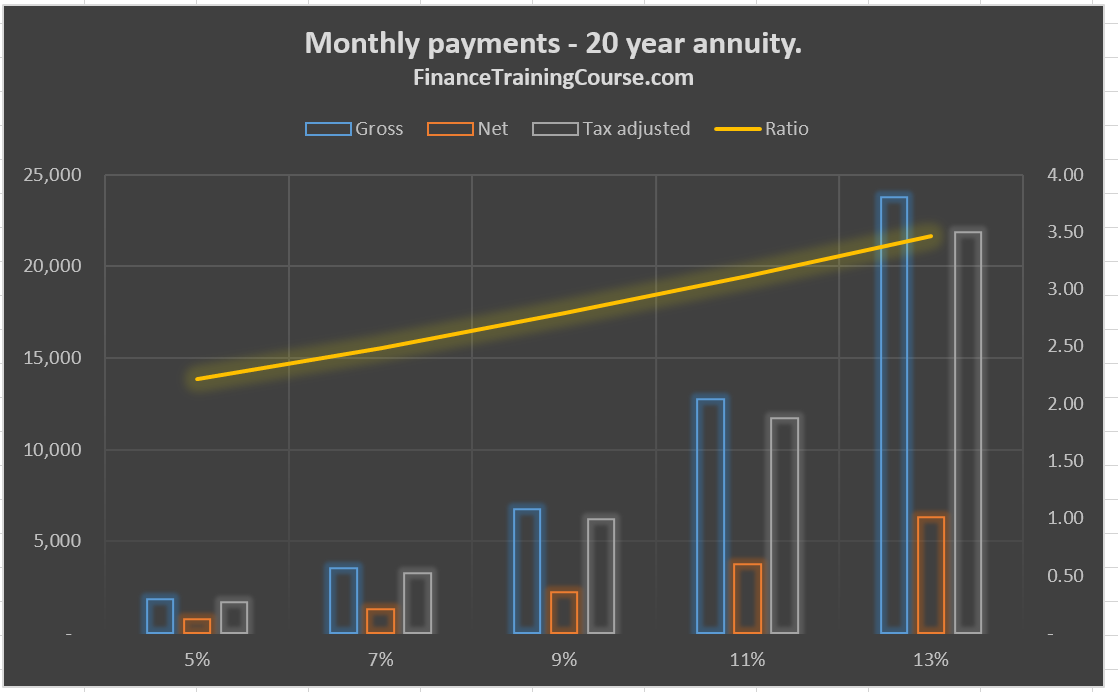
How big is the difference in monthly retirement payments due to the impact of taxes and fees over the savings cycle?
The impact of planning taxes properly and saving or reducing fund management fees translates into a difference in endowment as well as payments of as much 350% over 35 years. Imagine having 3.5 times more money when you retire. Imagine receiving a monthly pension payment of US$ 2,000 versus US$ 7,000. Which one would you prefer? That is the impact of small choices. Possibly also a big reason for you to start learning more about the field of portfolio management and tax deferred saving and endowment choices.
A natural question then is why don’t more individuals and professional manage their own money or take charge of their retirement saving choices. If that is a tall order, why don’t they make tax efficient saving choices? One big factor is instant gratification. Our trading choices sometimes focus more on short term gains versus long term bets. Short term trading choices and the resultant churn also creates short term tax impact. Thinking long term is a challenge when faced with attractive short term returns, even more so when media influences and coverage bombard us on a daily basis with how well certain commodities, equities and securities have done over a recent reporting period.