Some say it is basic statistics. Other’s are in awe of it. And for groups outside of risk management and treasury, it is simply an alien language. Value at Risk or VaR for short is all that and more for anyone that deals with market, credit or operations risk.
While we have had a pdf based course and worksheet for Value at Risk available for sale on the Finance Training Course platform, there have been quite a few requests from our users and customers about a video based course that helps customers build their own VaR sheet.
Broadly speaking within the Value at Risk crash course this is exactly what we have done. In a handful of short sessions, we start off with a quick theoretical review, cover the Nassim Taleb qualifications and then get into building the Value at Risk spreadsheet. Topics covered in the session include
a) Calculating volatility and training volatility for a single position or security
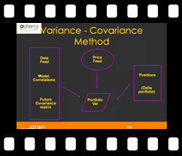
b) Calculating volatility for a portfolio using the standard variance co-variance (VCV) approach as well as a portfolio shortcut approach that does not require the construction of the VCV matrix
c) Calculate Value at Risk using Variance Co Variance (VCV) and Historical Simulation approach and compare the results
d) Calculate Value at Risk (VaR) for fixed income instruments introducing the concept of Rate VaR, Price VaR, Full Valuation VaR and Delta Neutral VaR.
In addition to the two theoretical review sessions, the course also includes a hands on excel model building walk through exercise.
Value at Risk: Model Building Walkthrough
We start will a simple data sheet comprising of 4 currencies. Step by step we construct an excel sheet that handles the calculation of value at risk for each currency under the variance covariance (VCV) and historical simulation approaches. In addition to this we:
- Calculate 11- day Trailing volatility (minimum and maximum volatility) and its graphical representation which are useful for interpreting VAR results
- Calculate Daily, annualized and holding period volatility
- Calculate a crude check of the worst case loss and VAR result using the maximum trailing volatility figure and the holding period and present an interpretation of the disconnect between this crude measure and the VCV VAR.
- Show how to install and use the in-built Histogram (Data Analysis) function of EXCEL to determine the worst case loss for the historical simulation approach.
- Compare the VAR results under both approaches.
Value at Risk: Portfolio VaR Model Building Walkthrough
In this session, we extend the earlier discussion regarding VaR calculation for currencies to commodities. We then demonstrate how to calculate Value at Risk for a portfolio of securities using both the Variance Covariance (VCV) approach as well as the Historical Simulation Approach. We use a shortcut method for the VCV approach that bypasses the need to construct a VCV matrix. However, we also cross check the results from this shortcut method with those obtained from the matrix method. During this course, we demonstrate the use of EXCEL’s in-built TRANSPOSE and MMULT functions.
We hope that the free samples will help you better evaluate the fit of our content with your training needs and will help you make a more informed purchase decision. If you need any additional purchase assistance, pre-register for the course or to avail the pre-registration discount please drop us a line at [email protected] or [email protected].
Calculating VaR (Value at Risk) – Part 1a – Theoretical Overview
 In part 1a, we take a detailed look at Value at Risk, VaR. We consider its various definitions and the questions that it may be used to answer. We see how the tool may be extended from its traditional market risk application to other applications such as margin management and profitability calculations. We consider how VaR is used to estimate capital for capital allocation purposes, marginal capital needed for additional investments made, to make comparisons of risk measures over time. We look at the general step-by-step process followed for calculating VaR and an introduction on the difference and uses between Rate VaR and Price VaR for calculating risk on Fixed Income securities.
Calculating VaR (Value at Risk) – Part 1b – VaR Qualifications
 In Part 1b, we continue with our discussion of Value at Risk, VaR, starting with the difference between Price and Rate VaR. We move onto another VaR Case study which looks at the determination of VaR using the historical simulation approach. Next, we review in detail the processes behind the calculation of each of the three VaR methods, issues with each method and comparisons between them. We see how the calculation is impacted for a change in the liquidation or holding period assumption. Lastly, we look at Nicholas Nassim Talebs views on VaR in particular his rules for risk management.
Calculating VaR (Value at Risk) – Part 1c – Calculating VaR for a single security using VCV & Historical Simulation approaches
 In part 1c, we walkthrough the process of calculating VAR for currencies. We start with a simple data sheet and construct an excel sheet that handles the calculation of VaR for each currency under the VCV & historical simulation approaches. We see how daily, annualized, holding period and 10-day Trailing volatility are calculated. We present a crude approximation of worst case loss using the maximum trailing volatility figure and use it to present the disconnect between actual loss and that given by the VCV VaR measure. We review the installation of the Data Analysis function in Excel and use the in-built Histogram function to determine the worst case loss for the historical simulation approach. Finally, we compare VAR results under both approaches.
Calculating VaR (Value at Risk) – Part 1d – Extending the VaR model to a portfolio. Calculating portfolio VaR without a VCV matrix
 In part 1d, we extend the earlier discussion regarding VaR calculation for currencies to commodities. We then demonstrate how to calculate Value at Risk for a portfolio of securities using both the Variance Covariance (VCV) approach as well as the Historical Simulation Approach. We use a shortcut method for the VCV approach that bypasses the need to construct a VCV matrix. However, we also cross check the results from this shortcut method with those obtained from the matrix method. During this course, we demonstrate the use of EXCEL’s in-built TRANSPOSE and MMULT functions.
Calculating VaR (Value at Risk) – Part 1e – Value at risk for Fixed income securities – Rate and Price VaR; Delta and Full Valuation approaches
 In part 1e, we review how the VaR measure is calculated for Fixed Income bonds using the Rate VaR approach and the Full Valuation Price VaR approach and the difference between the results of these two approaches. We see how a Delta Normal approximation applied to the Rate VaR approach improves on the results as it adjusts the measure for the specific characteristics of the bond (i.e. maturity, yield, interest rate sensitivity, etc). We discuss how this approximation can be further improved by considering the convexity adjustment. Finally, we illustrate the difference between Rate VaR and Price VaR by looking at the histograms of daily rate and price returns respectively.
For Calculating VaR (Value at Risk) Please Visit Here.