What is Risk? An introduction to risk assessment mindset.

What is Risk?
When it comes to financial risk, is it just price movements? Is that all there is to risk assessment?
Prices go up and down. It is an accepted fact of life. Markets, prices and price movements are uncertain, that too is given. And the most basic definition of risk is uncertainty. But how do you measure risk and uncertainty? Where would you start with your risk assessment exercise?
When it comes to financial risk management, we measure price movements (financial risk) with volatility (a fancier term for standard deviation) or Vol (not volume) for short. We use a simple measure to answer a simple question. By how much can prices move over a given time period?
We calculate volatility by using the daily change in prices on a relative basis. Also known as the daily price or percentage return. The daily price return series simply measures the daily change in prices from one day to the next. The alternate name is relative return.
There are many ways of presenting daily percentage returns series. You can do (P1 – P0)/(P0) where the P stands for Prices (P1 is new, P0 is old). The result is percentage return. You can also do the natural log (ln) of P1/P0 which is approximately equal to the first formula.
Once you have the daily returns series the simplest visualization of all is a raw dump of calculated returns as shown below in Figure 1.
The returns have been calculated for the WTI crude oil benchmark from a price series starting Jan 2004 and ending September 2012.
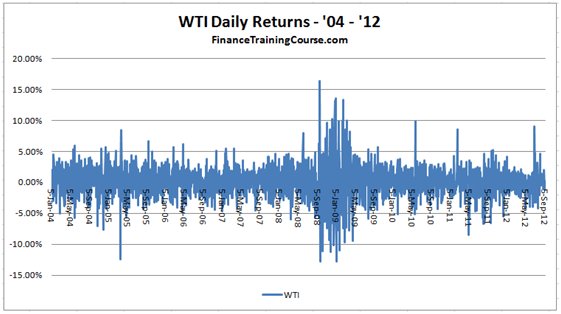
Figure 1 Crude Oil Spot Prices – WTI Benchmark – 2004 – 2012 – Daily returns series
A simple eyeballing of the above graph shows that the expected range (what you are likely to see on a day by day basis) is between +5% and -5%. The unexpected (less likely or rare) lies between +15% and -12% using 8 years of data. If you are interested in the totally unexpected, we know that it will be higher than our estimate of the unexpected, but we don’t know how high.
A more sophisticated approach would look at distribution of returns rather than a raw data dump and depending on the type of the financial security we are tracking, possibly give us some idea about what to expect from the unexpected.
Beyond the simple dump above, the distribution tells us how frequent certain values are, how infrequent extreme results are, what is the complete range or values we are likely to see. Using history as a bench mark how good or ugly prices (actually returns) can really get?
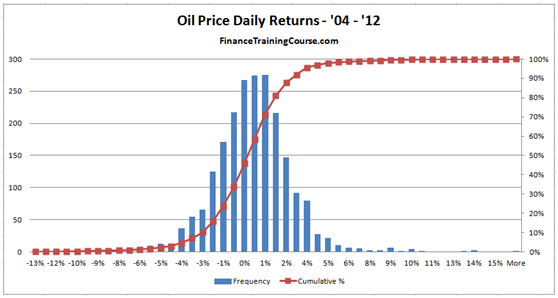
Figure 2 Histogram of Crude Oil Spot Prices daily returns – WTI Benchmark – 2004 – 2012
A third approach would extend the analysis by calculating volatility (our old friend standard deviation) trends and comparing them with other related commodities such as Gold and Silver on the precious metal front and the Euro USD exchange rate on the currency front. It also gives us an indication of how high volatility can go and how that can impact the price ranges we have just estimated above. (Expectations from the unexpected).
Similar to the range of prices estimated above, it is useful to have a range for volatility. For oil (WTI) using Figure 3 below, the range is between 1% to 8% daily; For EUR/USD its 0.75% to 8%, while for Silver volatility clocks in between .8% and 8.5% daily.
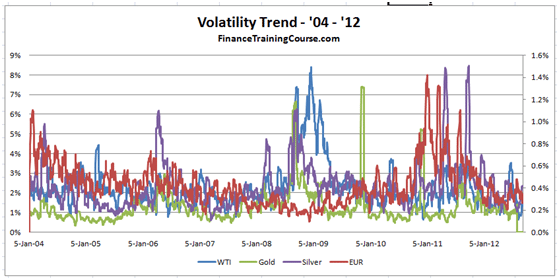
Figure 3 Risk Assessment – Volatility Trends – 2004 – 2012- Precious Metals, Crude, Euro
By now a trend should be visible. Risk, volatility, price movements are not constant. They range. They have seasons. They go through violent mood swings. Some years are better than others. Some years are disasters.
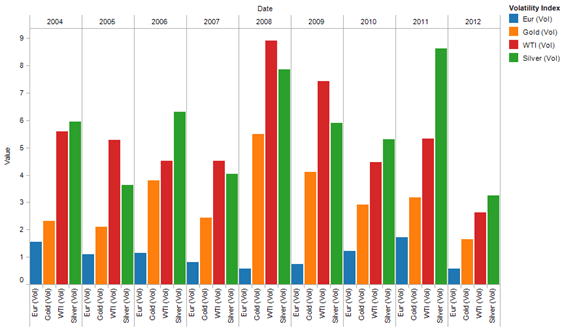
Figure 4 Risk Assessment – Volatility Index – 8 years – 2004 – 2012
If you trade in risk, 2008, 2009 and 2011 were great years. 2012 was a terrible year for traders. There was uncertainty. There is always uncertainty, but nothing like 2008 levels. Only matched by the spike that followed when the US credit rating was cut by a notch in 2011.
Traders like risk and uncertainty because uncertainty breeds opportunity and trades. Stability is great for grandmothers and Warren Buffet but toxic as cyanide for trading P&L and trading desks.
If you are an ordinary mortal and not a trader, you tend to misread risk. We do a poor job of forecasting, estimating and assessing risk because we don’t deal with it on a daily basis. We assume that our intelligence, our background and our experiences give us licence to forecast the direction and magnitude of the next wave of risk, but we are wrong. We overcompensate. We are cautious. We ignore history and trends in favor of our own biases. We play it safe.
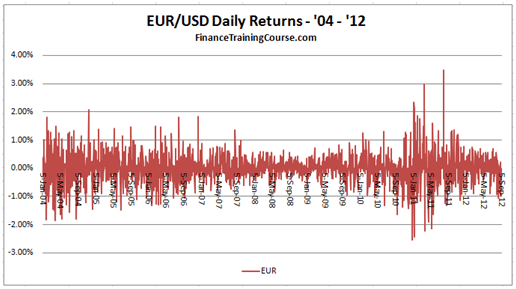
Figure 5 Risk Assesment – Eur/USD Exchange rate – Daily rate changes – 8 years – 2004 – 2012
A safe player not raised on a strict diet of trading and risk would never forecast a 3 times jump in underlying volatility in the Euro-USD exchange rate. In fact with the stability and strength in Euro seen in 2008 and early 2009, you would be laughed out of most board rooms for suggesting such an event. The prevalent school of thought predicted the demise of the US dollar as a global reserve and its replacement by the European Union Standard, especially after the 2008 asset backed security crisis in US markets.
What is Risk?
Risk is uncertainty. Risk is opportunity. Risk is misunderstood. Then how should one think about risk?
Here is a simple rule. Don’t think in terms of absolutes and averages. Think in terms of levels, trends and scales. The risk is not that you will get the average or the averaging period wrong. The risk is that you will misread the level/threshold of risk you are facing. You will misread the change and miss the transition to the next higher level.
Expect the unexpected to misbehave and surprise you. It will.

Explore the unexpected.
If you would like to learn more about risk and the unexpected, see our free series and follow on posts on risk and risk management below.
What is Risk? Risk measurement – Self Study reading & training materials.
Comments are closed.