Treasury E-learning course: Dissecting Treasury Products using Payoff diagrams
This is the second part of the transcript from one of 5 sessions of the Cross Selling Treasury Products Training Video. Also see our free online treasury risk training guide.
The most powerful tool that you can use in Treasury conversations and Treasury sales engagements is this two by two matrix (below) and grade school mathematics. I basically have a grid and this grid has four quadrants. I’ll call this quadrant one [top left hand side of grid], I’ll call this quadrant two [top right hand side], I’ll call this quadrant three [botton left hand side], and I’ll call this quadrant four [bottom right hand side].
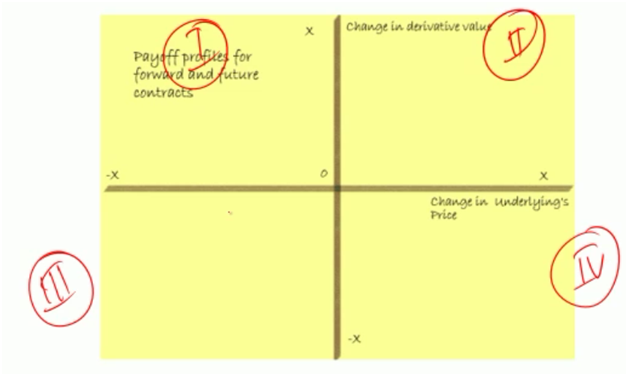
If you look at the grid, I have two axis. The first axis is the horizontal line. The horizontal line represents the change in the underlying’s price. What is underlying? If you go back to the definition of a derivative contract- A derivative contract is something whose value is dependent on some other external factor. It has no value on its one. For example if you are dealing with a currency pair and let’s say that currency pair is USD-JPY, a derivative contract on USD-JPY is completely determined by the change in value in the exchange rate between the USD and the Japanese yen. The contract by itself has no value. Whatever change in value [of the derivative], plus or minus, happens, happens because of a change in the value of USD-JPY. In this specific case USD-JPY is the underlying, and this is the derivative contract.
If I look at the axis, the horizontal axis you see here represents a change, let’s say this is where we are now- at point zero, both on the negative side which is quadrant I & III and the positive side which is quadrant II&IV, in the value of the underlying. The vertical axis on the other hand represents the change in the value of the derivative product and the derivative contract.
We take the simple example that we looked at earlier dealing with a customer who needed to sell 1 million euros in 90 days. What was the risk of this customer? Let’s say he gets a rate of 5.0. The bank that he goes to, to sell his 1 million euros, the bank comes back and says that I will buy these euros from you at 5.0. The challenge that this customer has- let’s say this is 5.0 and this is 5.1 and this is .2, .3., …, 6.5, so this is the change in the value of the underlying. Now if he sold it at 5.0, for every unit that the price of the euro moves up, does this guy make money? If he makes money you would draw a (grid) line in this direction, if he loses money you would draw a line in this direction. In this specific case because you have sold it at 5.0 and at maturity 90 days euro is standing at 5.8, the difference in the structure is the difference between 5.0 and 5.8, which is the amount of money that you [customer] would actually end up losing. If this is the value [5.8], then you are basically saying that this customer lost this much. What you have effectively done is that you have define two coordinates (x,y). In this specific case the x is your horizontal axis, your y is your vertical axis. Horizontal axis is 5.8, vertical axis is -.8, and the line that marks this loss is the line that shows you the payoff profile of your structure at maturity at the end of 90 days depending on what the underlying exchange rate was.
This tool, this grid is one of the most powerful tools that you can use for analyzing what you normally call payoff profiles. And the reason why I emphasize, work and spend so much time dissecting, understanding, documenting and building payoff profiles is very simple; is when you see a term sheet, the term sheet doesn’t tell you that I have used product A +B+C+D+E. A term sheet basically says, if you see scenario A you will get paid X, if you see scenario B you will get paid Y, if you see scenario C you will get paid Z. Your challenge working as a treasury professional is to take this term sheet and turn it into this payoff profile. If you do this successfully, you would do exceedingly well because you would understand what the counterparty, what the competition sitting on the other side has done by combining A+B+C. You would read this structure and immediately know that they have taken one part A, one part B and one part C and have sold the customer something called D. But if you can’t this term sheet and translate it into this diagram then you will always be clueless about what exactly has gone into D. And if you are clueless about what has gone into D you can’t price it. If you can’t price it, you can’t value it. If you can’t value it, you can’t compete against it. Which is the reason why we are going to spend a fair bit of time in understanding the diagram.
The first structure that I want to look at is what we call a forward contract. This is the same example we looked at earlier, where we said one million euros need to be sold in 90 days. The exchange rate I have gotten is 5.0. If you go back this is exactly what we have done here, we have drawn this payoff diagram. But we have drawn this payoff diagram for the scenario when rates close at [5].8, or .7 or .6….1. What if rates do not rise and as expected they actually decline? In that specific case because you have sold at 5.0, for every unit decline in value that’s your payoff profile. If you take the pieces you actually have a straight line that goes at a 45 degree angle on both sides. And this payoff profile represents the payoff when prices rise and when prices decline.
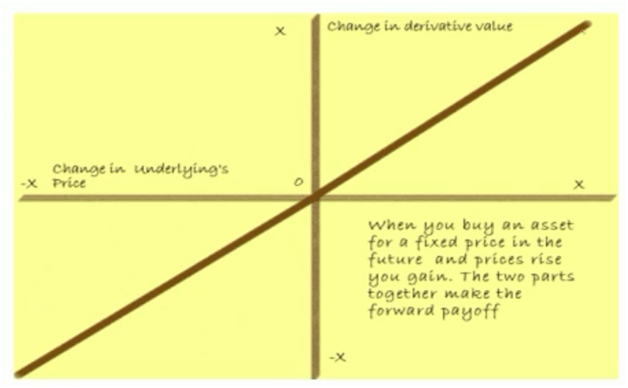
In this specific case, I am selling Euros (red line). If I want to buy euros, my payoff profile is going to be the exact opposite (black line). If I bought euros at 5.0, as euro appreciates and goes to 5.8 the value of my holding increases because I’ve bought something at 5 which is now worth 5.8. And this incremental (5).8 is money in my bank account. Similarly if I bought it at 5.0 and it goes all the way down to 4.1 then the difference between 5.0 and 4.1 is money that comes out of my pocket. This is our forward contract. If I drawn this formally. This is the downside when I am long a forward, and the downside is that prices will fall. This is my upside when prices rise and go up. So upside and downside.
The problem that you face, go back to the first [client] reaction. The customer comes back and says “Can you do something to limit the loss? Can you do something to reduce the downside? Can you do something to make sure that I don’t lose money? Can you do something to eliminate this?”As it happens, yes, there is something we can do to eliminate it. This something is what we call an option. If you want me to get rid of this nasty piece of work here that you don’t want to work with, then I will charge you a little bit. If you pay me this little extra then I will make sure that your downside is always limited to the amount that you pay as a premium, no more, no less, but your upside is unlimited. If I go back to the previous diagram, this was my upside if prices rose and I was long, I was buying euros; this was my downside if I was long, if I was buying euros and prices fell. So I’m [customer] saying I love this piece [quadrant II], I really want to make money here but I don’t like this piece [quadrant III] get rid of it. I [TMU] am more than happy to get rid of it as long as you pay me a premium. Your revised payoff profile looks like this, as long as prices rise you’ll make some amount, whenever prices decline your downside will be limited to a fixed amount that you would have paid. I am going to call this fixed amount the premium.
The first product was a forward contract that gave us the right to buy something at a future date in return for an obligation that we had to buy even if rates fell at the future date. Effectively locking us in at a fixed rate, X. This is a forward contract. So from a forward contract we will now move on to an option where we are saying that we have the right to buy at a price that we have agreed upon today as long as the price that the market has is higher than the price that we have agreed upon today. Let’s call this price that we have agreed upon today X, or a strike price. I have the right to buy the underlying at the strike price if prices are above the strike price. But if prices are below the strike price then I don’t have the obligation to perform. I can walk away. When I walk away in terms of compensation, I leave behind the option premium that I have paid. So if the option is worthwhile, if it is worth something, I exercise and buy it. If it is not worthwhile, if it is trading at a value or an amount that is actually less than the strike price then there is no issue, I can simply walk away and leave behind the premium as compensation.
When we have the right to buy something at a future date for a price that we will determine today we name it or call it a call option. The challenge is that if you are a buyer of a call option, this works. You have the right to buy but not the obligation to perform. If you are a seller of a call opton, you get to keep and make the premium as long as the option is not exercised. But once the option gets in the money and is exercised you can actually lose a fairly nasty amount of money. And the concept is that this amount of compensation if you know what you are doing should be adequate for the few instances when the option is exercised. If you write 1000 options over a year only a few of them as per your model will get exercised and the ones that get exercised are adequately priced in the premium that you are charging. Let’s say you write a 1000 options and 10 of them get exercised. The premium that you receive for the 1000 options should adequately compensate you for the 10 that get exercised, as well as for the expense or the amount of money that you spend in covering yourself, in hedging yourself, in running the book and so on and so forth.
If we flip this, I don’t want to buy I actually want to sell. I want the right to sell something that we have agreed upon at a price that we have agreed upon at some point in time in the future. In this specific case you are looking at a put option. As we said earlier, in this specific case if you are looking at the grid, when I do a call option I make money when prices rise, I lose my premium when prices fall. For a put option I make money when prices fall, I lose my premium when prices rise. Again like the call option, in this specific case also, when prices rise and the option is worthless I lose the premium. When prices rise and it’s no longer worth my while to sell something at a lower price, which is the strike price here, it is better for me to let the option expire worthless.
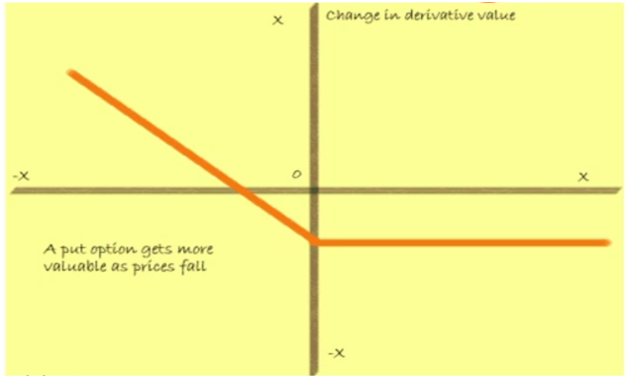
Once again, similar to the call option, if you are the seller, if you are the writer of the option contract, you are obligated to perform and you would book this loss. If you are the writer of the contract you make the premium as long as the option is not exercised but are then are on the hook for the losses that are realized if the option is exercised.
Having said that, to be fair, there is a mechanism, there is a process that option writers, that book runners use to hedge the bet. There are tools that they can use to cover the exposure. That’s something that we will talk about different in a later, maybe in a different part of the course.
If you combine a call contract and a put contract, we’ll talk about what’s wrong with this slide a little later, but for now if we combine a call option and a put option you should end up with a forward contract. The question that I’m asking here though is that what is wrong with this slide. If you take a position where you have a long call and combine it with a position where you have a short put, what do you get? What does this remind you off? Just this payoff profile, just this straight line in the middle. If you step back through all of the diagrams that we have seen so far, here you go. This reminds you of a forward contract. But there is one difference. What’s wrong with this slide, the one that we have just identified here, is that when you actually draw the payoff diagrams, this is your long call and this is your short put. Do you see? There is actually a distance between the two payoff diagrams which has been merged in this specific slide. While the next result is still a forward contract as indicated here, but the actual diagram is a little different.
Let us do a quick comparison and review. So we have got forwards, calls and we’ve got put contracts. If we take the example which we spoke about earlier. We are looking at one million euros, we are looking at a rate of let’s say 5.0. If I do a forward contract and rates go from 4.0, 4.5, 5.0, 5.5 and 6.0- these are the ranges of rates that we are likely to see. The strike for all three, for the forward, for the call and for the put is the same [5.0]. How much money do you actually make on the three structures in different scenarios? For a second let us ignore premiums. We have a forward contract and I’ve agreed to buy euros at 5.0, buying not selling. At 5.0 I make zero, if the rate jumps to 5.5 and I have the right to buy at 5.0 I make 0.5. If the rate goes to 6.0 I make one. If the rate falls to 4.5 and I have the right and the obligation to buy because I have a forward contract I lose 0.5. and if it goes to 4.0 I loss 1.0.
1, 2, 3, 4, 5 scenarios.
IF I have a call option, the call option gives me the right to buy but not the obligation to buy when rates are below. The strike is 5, at 5 I make zero. Like the forward contract at 5.5 I make 0.5 at 6 I make 1. But my primary challenge and my primary question is, what happens when prices fall to 4.5 and 4.0. Remember in this specific case we are actually ignoring the premium. We are just looking at the difference between the strike price and the market price, the strike price and the maturity price, what’s the payoff? In a call option we have the right to buy but not the obligation to perform. If prices fall to 4.5 there is no incentive for me to buy, I will not exercise. There is no incentive for me to buy at 4.0, I will not exercise, which means that here and here I have a zero.
If we switch this and flip this and say you have a put contract which gives you the right to sell and your worry is that rates will come down. On a put contract you have a right to sell at 5.0 would you sell at 5.0 using the put if prices were at 5.5? No, you won’t because you would simply sell in the market. You would no longer have a desire to sell using the put contract because the put contract locks you in at 5.0. Which means you would not sell [if prices were] at 5.5 and the option would expire worthless, leaving you with a loss of zero because you would not exercise the option. Here on the other hand [5.0] you make zero. But if prices fall to 4.5 you actually end up with a gain of .5 because you have the right to sell at 5 and the market is trading at 4.5. Similarly its 4.0 you have the right to sell at 5 and the market is trading at 4.0 so you end up making an additional dollar.
This short comparison actually gives you an indication of what the payoff profile would look like for a forward, for a call and for a put contract.
Now what I want to do is, if you go back to the client reactions, I want to talk to you about controlling the downside- how much money can I actually lose with respect to this specific structure. As we move forward in the session which is now going to follow, I’m going to walk through
- controlling the downside,
- reducing the cost,
- structured protectionàmatch my profile,
- yield pickup and adding bps to my portfolio and
- arbitrage plays.
That’s the game plan.
Before we do this I just quickly want to wrap up what we have done. What we have basically done is we have introduced first the most likely transactions that you are going to see at a TMU desk. And then we have gone out and said the most likely reactions that you are going to see at a TMU desk. And then we have gone out and introduced three very basic, very fundamental, very down to earth products called the forward contracts, the call contract and the put contract.
In the session that follows we will try and see how we can use variations of forwards, calls and puts; how we can combinations; how we can use some of the most advanced structures to address the most likely reactions you’re going to see when selling and pitching a product to a customer.
Till then I hope that you’ve enjoyed yourself and found this session useful. This is Jawwad Ahmed Farid signing off for financetrainingcourse.com. Thank you very much for your time.
