Selling Treasury & Derivative Products: The Petrochemical Case Study: Estimating client exposure to crude oil price volatility
This is the transcript from the video recording for session three of selling treasury products where we use the case study of an oil refinery to show how to translate impact of crude oil price volatility into P&L and margin impact. This impact forms the basis for exposure estimation used to suggest an oil price hedging solution to a customer impacted by a change in crude oil prices.
Follow us on YouTube, Facebook, Linkedin, Twitter
Cross Selling Treasury products: Introduction
Hello and welcome to our session on Estimating Customer Exposure (For Treasury trades and customer limit management). This is a third session in our series on Selling Treasury Products. We covered a fair bit of ground in our first two sessions where we laid the foundation for some of the tools that we are going to use in this session on Treasury products. We use an actual case study from some real life work that we did for a client.
Cross Selling Treasury & Derivative products: The Crude Oil price impact case study
The case study deals with the risk management and hedging needs of a crude oil refinery operating in an emerging market.
One of the first questions that come up (from a risk exposure point of view) is that there is a lag between the time that crude oil is purchased, it arrives, and is converted into a product that is then sold in markets for distribution. The challenge is that in the 30 days that it takes for the refinery to place an order for purchasing crude to the time that crude actually arrives and is converted to a derivative product, the retail prices are set by a market price regulator. These retail prices are linked and dependent to what is happening in international markets. One of the big risks and exposures that they [the refinery] worry about is that if prices move in the international market and those prices are used by the regulator to set prices at a level below [their] cost. The market regulator links prices to international crude prices and this is linked to a specific crude oil blend. There is also a question of how closely the input blend that they consume to produce the output matrix they produce, how closely is this input blend related to the international blend used by the regulator to set prices. That is the context for our case.
If I graphically represent the question that the client asked us:
First question was there is a price fix and this price fix happens on two sides. The supplier of crude updates prices at the end of the month. The regulator also updates prices at the end of the month. The supplier of crude sets prices on a backward looking basis. On the 30th or 31st of the month he would announce that for all purchases picked up over the last thirty days, here is the price. The regulator on the other hand sets prices on a forward looking basis. He goes out and says that all sales of petro chemical products in the local market would now be sold at this new price (based on a the last 30 day price average).
So, one question is what is the manufacturing or processing lag? If you think in terms of time that an order is placed for the purchase of crude to the time that it is shipped you’ve got a 4 week lag. Then anywhere between 10-15 days from the point when the crude reaches the refinery to the point when it is produced and reaches retail distribution outlets such as petrol and gas pumps.
Selling Treasury product: Crude Oil volatility exposure: Setting the stage for analysis
The client has two questions:
- Their first question is what is the shape and form of our exposure? Are we exposed to prices going up? Are we exposed to prices coming down?
- In the context that we are interested in, how does prices going up, prices going down has an impact on our Accounting P&L and possibly even on our Balance sheet.
To begin with our focus and our discussion would primarily center on the P&L impact.
When you work with a refinery, you have a list of products which the refinery produces. The assumption that we have made is that this refinery for every barrel of crude it consumes, produces a portfolio of petro chemical products. What is included in these petro chemical products? We have high sulfur crude oil, which is about 32%; we have NAPHTHA which is about 0%; we have motor gas which is a auto petroleum product; we have high octane motor gas which is HOBC; then we’ve got Kerosene; and then a variation of Kerosene which is called aviation fuel or jet fuel; high speed diesel and LDO; so eight [products]. This output determines what are called gross refining margins for the refinery in question. That’s the first step. If I have this mix, I have a fair idea of what the refinery would produce and where prices would be for this specific product in both my market and the international market.
The second thing that I want in terms of assumption is the change in the price of crude oil in a unit that I can work with.
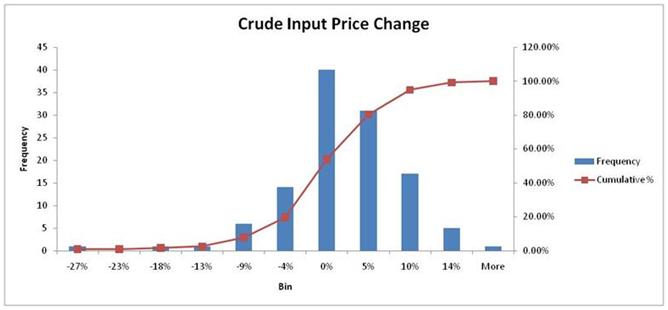
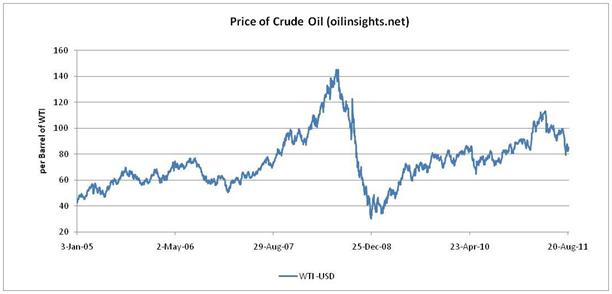
In this specific case, prices of crude oil for the period in question that I am working with/ studying with move by about -27% on the downside and about 14% and more on the up side. That gives me the range. The bulk of changes in our histogram were around zero (this is price changes on a month by month basis. One month to the next month what was the most likely price change?). The most common changes other than 0 were an increase of about 5% and a decrease of about 4%. My worst case decrease was about 27%. My best case increase was about 14%. This sets the context for price of input. This is the range by which price of input can actually go out and vary.
Now look at (petrochemical product) output prices. What I’ve done is, if you remember the product matrix that I had used that gave me my gross refined product margins, if I look at my GRM, my output price changes tracks that based on the input price changes and the translation of those input price changes into output prices, how much have my output prices changed over the period from 2005-2010. In this case I am saying that my worst case change is about -44%,-45%. My best case change is about 9%. Effectively you are saying -27% and 14+% translate into a loss of about 44% on the margin [output] side to a gain of about 9%. It doesn’t translate directly into -27% and 14%, it translates into -44% and 9.1%.
Then if I look at the change in my margins, I do another layer of analysis where I calculate and estimate the real margin change. In this specific case, in terms of drop in my margins my low end is about -14%, my high end is about 35%+. I’m looking at the period in question, 2005-2010. The context in this specific case is a Refinery.
So the assumptions that we have looked at…We started off with our context which is price gets fixed by the supplier of crude, price gets fixed by the regulator of petro chemical refined products, there is a manufacturing and processing time lag, there is potential exposure, our focus is on P&L. Then we move on and said that to move forward we need to look at what is the product matrix that is used by the refinery to produce refined products. Here is the product matrix. The analysis that we are doing is based on the numbers that we see here. From here we move on to the next stage where we say, how volatile are input prices over a period from 2005-2010? What is the range of changes I’ve seen in prices on a month by month basis? That’s -27% to 14%. What’s the impact of these changes on my output prices? The impact goes from -44% to 9.1%+. Then what is the impact on my margins? The impact on my margins is about -14% to about 35%. That’s the context.
Selling Treasury product: Crude Oil volatility exposure: The analysis
We take this context and we do some basic analysis. What we want to do is that we want to exactly understand the amount of time that it takes to manufacture the product. This gives us, along with the shipping delay, the holding period. That is the period in which we are interested in calculating the impact, calculating the range of price changes that are likely to occur. We also want to look at the lag between the retail price fix and the retail product delivery. We want to look at the break down between the fixed and variable pricing, the breakdown of the dollar sensitivity to changes in input prices, and estimate the projected impact on P&L.
We take this analysis to the next stage. The first question that I want to ask is, look at my margins and tell me what you see based on the historical analysis of my production, of changes in crude oil prices, changes in output prices and changes in my net margin. I go out and prepare a table. In this table I actually have two models.
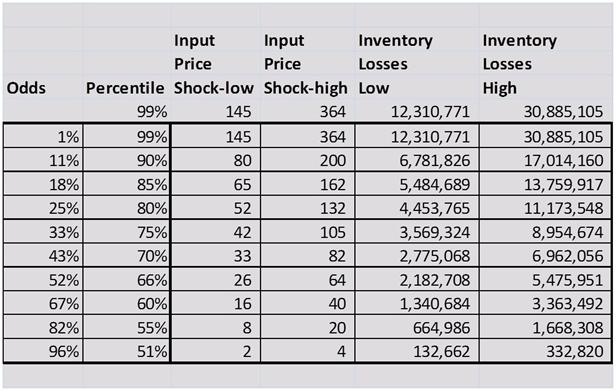
I have a model where I assume I have an average or low vol. world. Then I have model where use a high vol. world. If you have completed the first two sessions you know by now that volatility as we calculate it does not remain constant, it goes up and comes down, and this is on a trailing volatility basis. As you reduce the trailing window, you may see vol go up and down just like prices. We are saying that the low vol world refers to the low point, and the high vol world refers to the high point in that series. This is my low vol. world. This is my high vol. world. In my low vol. world the worst possible shock that I can see is ±145. In my high vol. world the worst possible shock that I can see is ±364. This worst case shock is linked to what we call 99 percentile, which effectively means that if we take a look at a hundred days there is going to be 1 day in those hundred days where I will see a price shock/ movement of ±145 or ±364 [or more]. In this specific case since we are dealing with a refinery and the history that we have available to us deals with price changes on a monthly basis, there is only a 1% chance, if the number of assumptions we have made in the model hold true, that price movements is going to range, from one month to the next, a number higher than 145 in the low vol. world and higher than 364 in a high vol. world.
One of the things I would like to clarify in this case is that the price of crude oil that we are calculating is in metric tons. So this is not a barrel of oil, this is metric tons of crude oil input, which means that the numbers you are seeing are not in the $75 to 125 or $60-147 range we see for a barrel of crude oil. Each metric ton has x number of barrels of oil. This metric ton has been multiplied by that x, and hence the price shock that you see here, which is about 145 to about 364. The prices and the change in prices are on a metric ton basis.
Here, I’m saying there is a 51 percentile chance. I’m saying that if I look at two days, then one in every two days I am going to see a movement in prices of about 1.6 and 3.9- $1.6 in a low vol. world, 3.9 in a high vol. world.
Selling Treasury product: Crude Oil volatility exposure: Introducing Margin shortfall
How does this translate into margin shortfall? What is the margin shortfall question? The margin shortfall question is what’s the chance, what’s the probability, what’s the likelihood that my margin will fall below the minimum threshold? If I have defined the minimum threshold, then I am saying that there is certainly even odds of seeing a 1% break if prices go up and down by the amount that’s in the list here, but there is only a 1% chance that you will see a margin shortfall of about 25% [in the low vol. world]. If you change this to the high [vol.] world there is a 1% chance that you will see a margin shortfall of about 63.4%. That’s how much your margins will shrink. When this number turns negative you are saying that margins are not going to shrink, margins are going to grow. Take the percentile ranking that you see here and then link them to both your low vol. and your high vol. worlds to find out what is the likelihood, what is the probability, what is the chance that your margins will grow or shrink by a certain percentage?
Once you have this table then a question that needs to be placed to the board of the client. That question is: Where exactly on this table, are you comfortable? I am comfortable with margin movements up to 10%, beyond that I have an issue. And if I say my number is about 10% in the low vol. world then from a threshold point of view I want to cover about 85% of the probability estimate. I’m interested in about 15%, or 1:4 or 1:5 odds depending on how you want to look at it.
This analysis focuses on P&L and margin impact. There is another aspect of this which deals with inventory losses. The idea is, I bought fuel at a price threshold of 147. By the time it was produced and was ready to be sold in the market, prices had dropped down to 100, 108, 105, or even 90 for that matter. The problem is my cost of input for this produce is 147, plus whatever my process costs and other expenses are. I can only sell this product in the market at 90. It’s not just a question of at what level my product gets sold. I have a substantial amount of inventory in my storage tanks. That inventory also gets marked down.
Selling Treasury product: Crude Oil volatility exposure: Introducing inventory losses
The second part of our analysis then says that in addition to margin you have another component of P&L which is your inventory mark up and your inventory mark down. Once again we have the same percentile. At 99 percentile you are looking at a loss of about 12 million dollars in the low vol. world. In the high vol. world that number is going to be about 30 million dollars. That is your worst case, that’s your 99%, that’s your 1 in 100 days number. Your most likely, that is your one in odd days, number is a loss of about 132 thousand dollars in the low vol. world and about 333 thousand in the high vol. world.

As before, once you get to the table what you have to do is sit down with the client and ask him how comfortable he or she is with these range of numbers and where does his risk threshold end/ finish. If he says in the low vol. world I can afford to do 3.5 million dollars but I want protection above this then that’s the threshold we come in and place a structure that works for the client.
If you think in terms of the questions that we want to ask and the questions that we have been asking using the tools which we have shared earlier, the first question is: What is the probability that margins will decrease in any month over the next quarter, the next half year, or the next full year?
The next question is: What is the range of these projected reductions? ± what number? That’s when you go from 99% to 66%.
What is the worst case reduction in any month over the next 12 months?
What is the likely reduction in any month over the next 12 months?
If you go back, from a margin point of view you are saying the worst case reduction is about 25% in the low vol. world and 63.4% in the high vol. world. And the most likely reduction is about 1% in the low vol. world and 3.1% in the high vol. world. That’s on the margin side. If you look at the P&L impact because of inventory mark downs and mark ups then in that specific case your worst case loss is about 12 million dollars in a low vol. world and 30 million dollars in a high vol. world. On the low side you are looking at a most likely change of about a 132 thousand dollars and 332 thousand dollars, depending on which world you are looking at, the low vol. world or the high vol. world you are operating in.
Other questions:
What is the probability that gross margins will shrink below the minimum probability threshold? Before you answer this question you have to ask; what is your minimum threshold?
What is the probability that gross margins will actually turn negative? You may actually start to lose money on each barrel of crude that you process and each barrel of produce that you sell.
Once again you go back and you walk through these percentiles. You can do probabilities or you can do odds. At extreme levels probabilities lose meaning. If you tell the board there is only a 1% chance, the board will immediately discount it. But if you tell the board, in the next 3 days, or in every pair of three days over the next twelve months, [in] 1 in three days we will see a movement or a loss or we will have to recognize a movement or a loss of this amount, I think that is a more credible number; which then means that you don’t do your analysis or your presentation at 99%. You most likely will end up doing it at the 75%, 66% or 60% level. I think these numbers are more meaningful with respect to the discussion with the board.
The primary objective of these discussions and asking these questions is to get the board to come down to a point where they can accept and acknowledge their risk appetite. How much money am I comfortable losing? That defines the protection that is required and desired. You can’t answer this how much question unless and until you actually have this table.
Moving forward…two sets of questions…next set… What is the likely expected gross margin number at current price volatility levels?
How will this number change if volatility moves by a percentage point?
By how much does a dollar change in crude prices change the expected margin number?
If you go back to the original table where we looked at crude oil input prices, this was just a first step. If I build a sequence for my model, I’m saying that my first step is this. My next step is the impact on output prices (so this is a relationship that I need to figure out and model). From this what is the impact on my Gross Refining Margins or my gross margins (and again there is a relationship). From my GRM I move on to what’s the impact on my inventory, what’s the final impact on my P&L? All of this is linked to Crude Oil input price changes. We have looked at models where volatility went up and then came down, then went up. In such a scenario if I have a low vol. world what is the impact of this model? If I have a high vol. world what is the impact of that high vol. on this model? What is the impact of P&L? Once I have this analysis then I simply go out and sit with the board till I figure out their risk preference and tolerance. The risk preference and tolerance tells me the protection level that is required, which tells me the pricing that I need to present in front of them.
Once I find the pricing and take the pricing back to the customer there is a very good chance that the customer will say this doesn’t work for one simple reason that it is too costly. And once he says it’s too costly that’s when you sit down and figure out what is the best possible structure for this deal. This is where the product portfolio that we looked at in our first session comes into play. This is where you sit down and try to understand how the business model of the customer operates, not in one day, not over one month but over the next three to five years. What are the drivers that push profitability, that control profitability over a long period of time? Based on this driver what is the most appropriate structure for this customer?
Selling Treasury product: Crude Oil volatility exposure: Wrap up
Very short and brief case study… Quick wrap up and review before we move on to the next topic. We started off with the context of a crude oil refinery that had an interesting situation where the price of both its input and its output was set by a supplier and a regulator and it had no control on both processes. There was a manufacturing time lag that allowed and created potential exposure that had a P&L impact. We looked at three things; we looked at the Gross Refining Margins. To calculate the gross refining margins we had to figure out what was the portfolio product mix the refinery was producing as part of its output. Based on this portfolio of products we looked at changes in crude oil prices, moved that to changes in output prices and finally connected that to changes in refinery margins of the refinery in question between the period 2005-2010. We then translated this into two tables. The first table was the impact on margins, the second table was an impact on inventory. And we took both of these to sit down with the customer and try and build a plan for estimating what exactly was the risk preference and tolerance of the customer, what was the desired protection level, what was the pricing? Then based on their reactions to pricing what was the appropriate structure?
I hope this gives you some sense of the amount of effort that’s required in estimating the actual exposure that a client has to a given commodity and then translating that exposure into a structure that makes sense. Once that structure is presented to a customer, depending on the reaction to the price of the structure, modifying and tweaking that structure so that it comes in within their price bracket. This is the process that goes on, on an iterative basis. There is a fair amount of back and forth between the client, between the bank or the advisor which is you in this specific question and then any execution agents that you have at the back that are physically deploying and implementing the structure which you use for the transaction in question.
I hope you enjoyed the session so far. I hope you now have a better sense of the task and the road in front of you with respect to estimating customer exposure. Thank you very much for your time. This is Jawwad Ahmed Farid signing off for FinanceTrainingCourse.com
Follow us on YouTube, On Facebook, On Linkedin, On Twitter