A History of crude oil price drivers
Over time we have analyzed the trend in crude oil prices and its various drivers and made forecasts about the direction that prices would take in the future. This post presents a review of the drivers and avenues of investigation used in our 2009, 2014 and 2018 analyses. A look at the past analyses helps identify which drivers were cursory indicators and which have been more stable predictors for crude oil price.
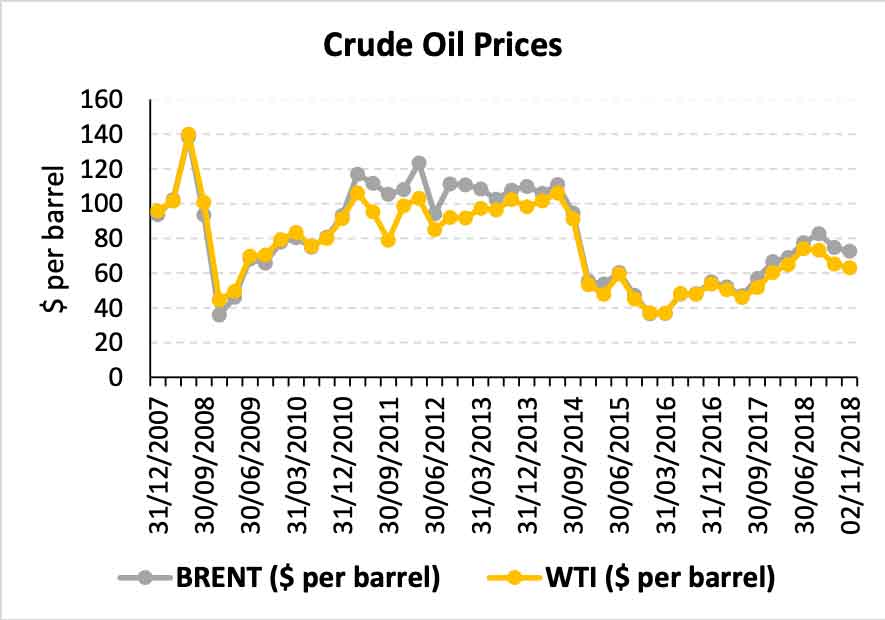
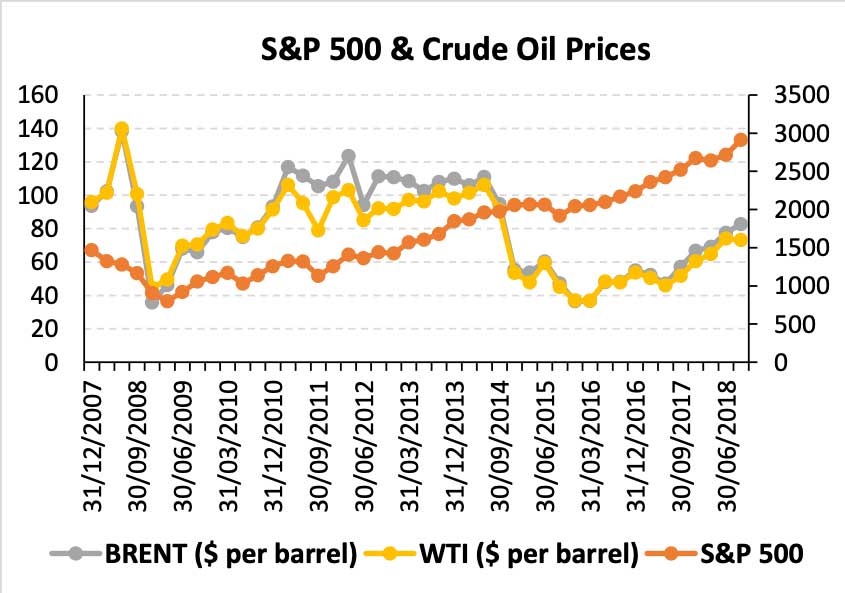
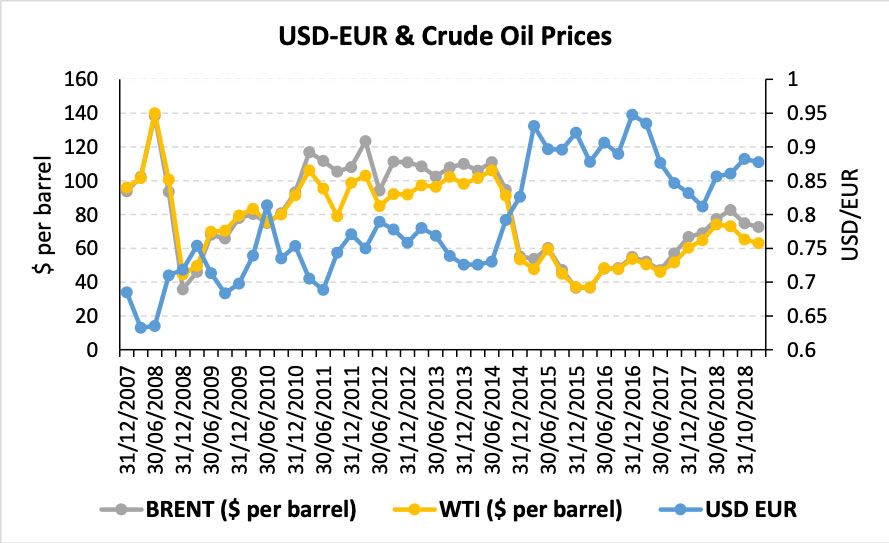
Before we begin let us take a look at crude oil prices over quarterly intervals commencing from December 2007 to September 2018. Data points for month end October 2018 and November 2nd, 2018, are also given.
October 2009 Analysis
a. Drivers
In our 2009 analysis we investigated five price drivers:
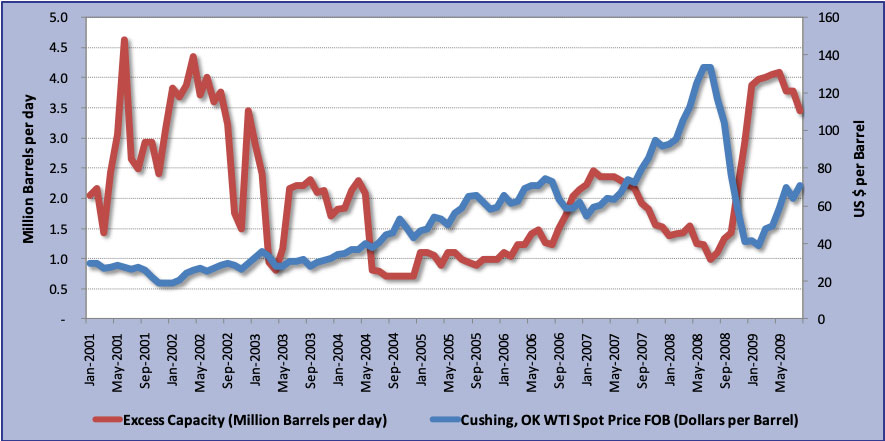
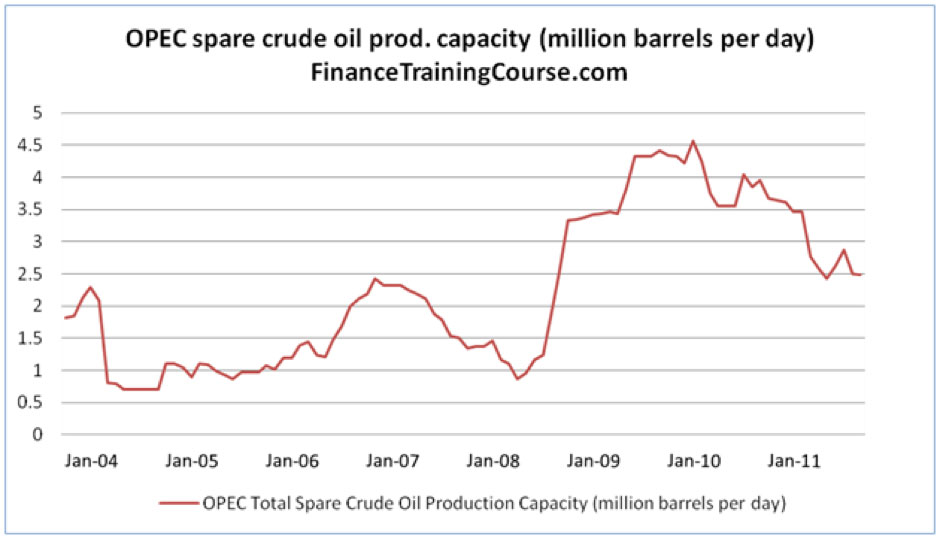
- Spare production capacity
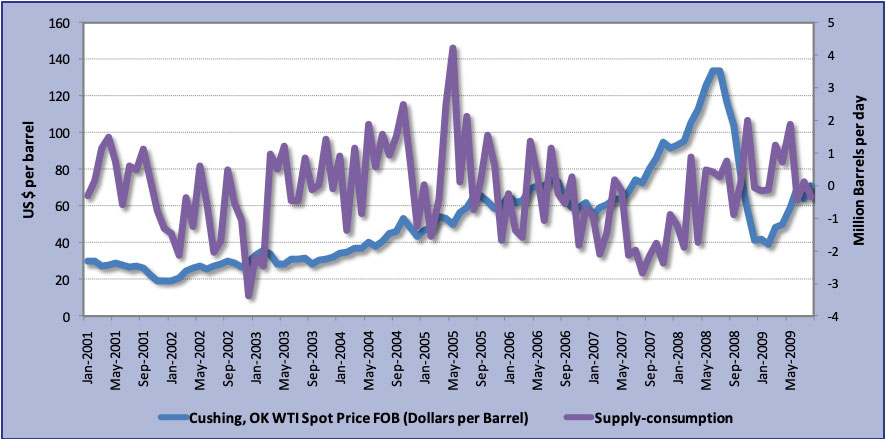
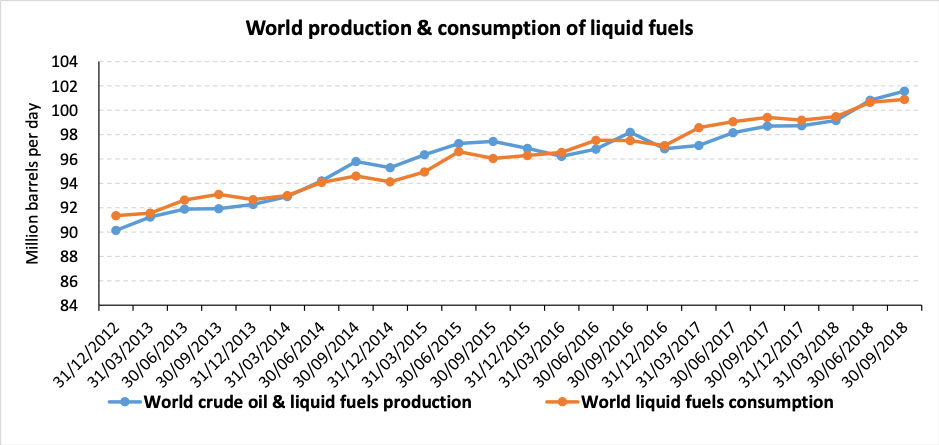
- Excess supply over demand
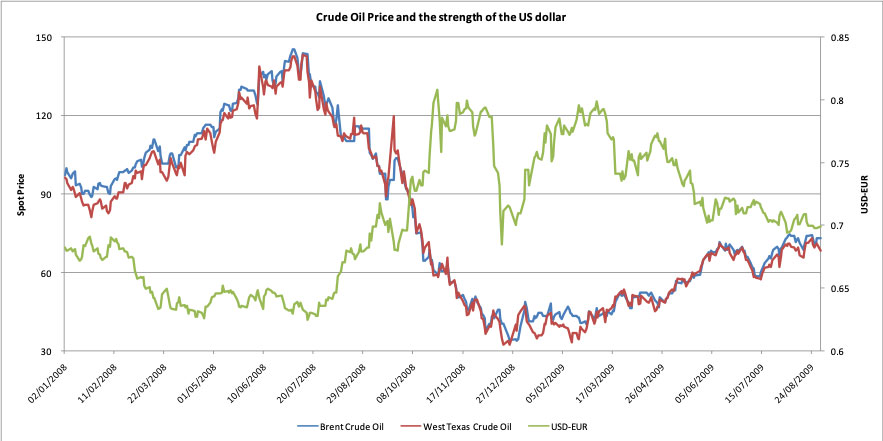
- Relative value and strength of the US dollar in relation to Euro
- Correlation with the equity market
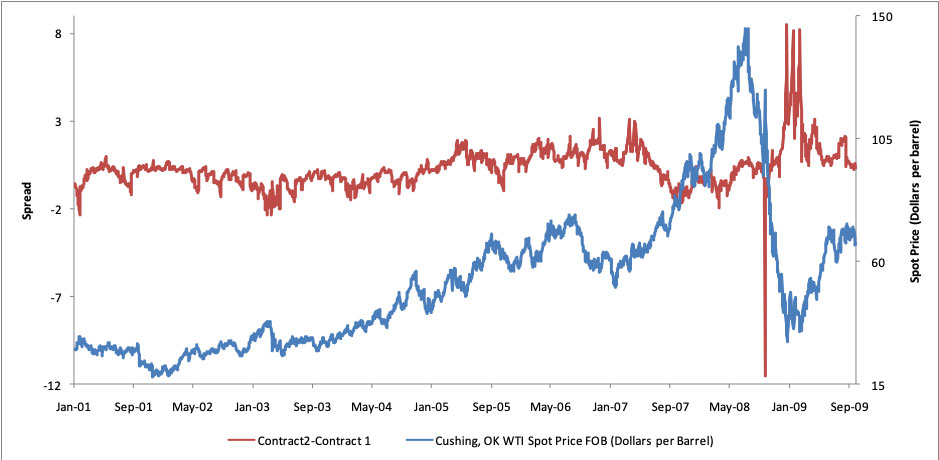
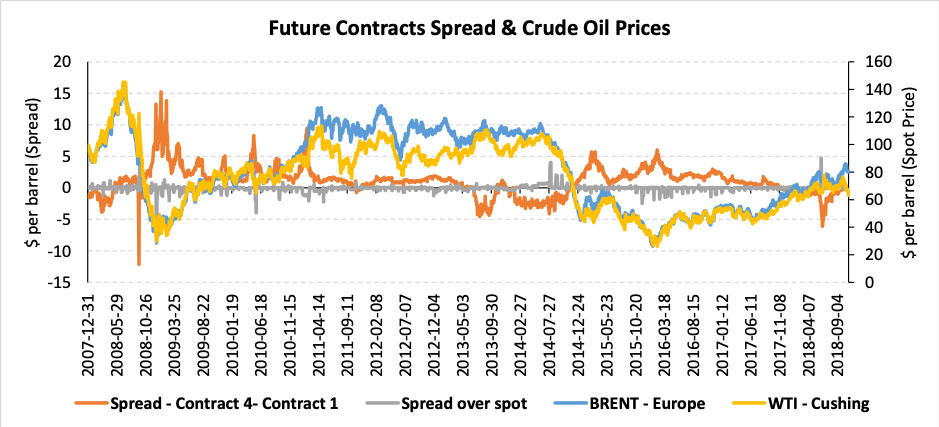
- Future contracts spreads
b. Outlook
We presented drivers that supported the school of thought that prices would fall – increasing spare capacity due to curtailment of production as a result of a fall in crude oil demand, and excess supply over world crude oil consumption.
We also discussed the opposite viewpoint, that prices would rise based on the weakness of the US dollar at that time as well as the narrowing spreads on future contracts.
We also studied the increased positive correlation between the S&P 500 and crude oil prices. The graph of crude spot prices and S&P 500 index for the months January 2008 to August 2009 seemed to suggest that prices of crude would increase with strengthening equity markets.
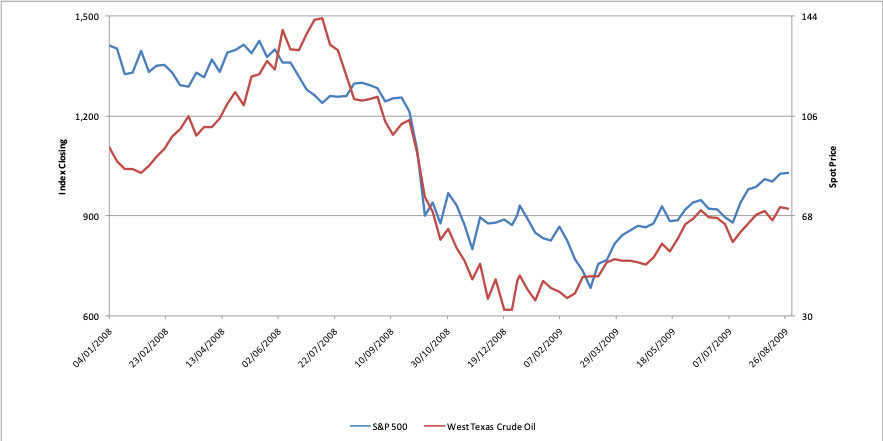
However based on data prior to the mentioned period as well as what has evolved since this relationship has been transient and the equity market driver hypothesis has lost its effectiveness as an indicator since 2013.
May 2014 Analysis
a. Drivers
In this update, we looked at the drivers behind a potential decline in crude oil prices. We studied:
- USD-EUR exchange rate volatility
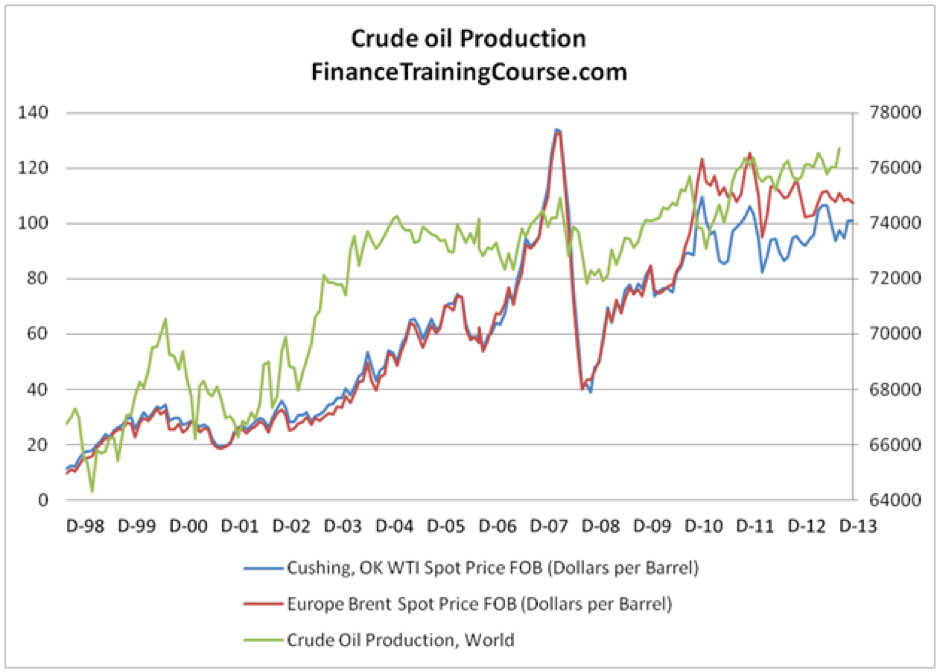
- Global crude oil production
- OPEC spare capacity
- Global liquid fuels consumption
- Correlation with the equity market
- Futures contract spreads
We also analyzed the reasons for the divergence between WTI & Brent spot prices.
b. Outlook
Based on the analysis we had predicted a decline in crude oil prices in 2015. This was supported by increased crude oil supply and declining OPEC spare capacity.
November 2018 Analysis
a. Drivers
In our most recent analysis we reviewed six drivers:
- Productivity to consumption ratio. Instead of looking at production and consumption separately or analyzing the absolute difference between crude oil supply and demand as done in our earlier two analysis, we transformed the data to a ratio. A value greater than one indicates oversupply.
- Rig count & productivity. We first looked at US rig count as a potential leading indicator for crude oil price changes in 2016. Rig count seemed a favorite among finance news websites and bloggers for predicting crude oil outlook. However decreased rig count does not necessarily mean a proportional decline in productivity, especially not in the face of increased rig efficiency.
- OPEC spare capacity
- EUR-USD exchange rate
- Futures contract spreads
b. Outlook
We led with the trend in the productivity to consumption ratio which indicated that due to oversupply in the market we would expect a decline in crude oil prices for the coming months of 2018-19. This was supported by an increase in US rig counts, sustained per rig productivity in the US & declining OPEC capacity.
A strengthening US Dollar relative to the Euro means that future crude oil prices are likely to fall not only because WTI & Brent are priced in US Dollar per barrel and will reflect the appreciation in US dollar purchasing power, but also as investors move away from commodities markets to currency markets.
Positive future spreads indicate that the market expects crude oil prices to continue to decline, at least in the short term.
To read more about the analysis and see a visual representation of the trends across the years click here.