Ladder options are options where the strike is reset whenever the price of the underlying asset reaches certain trigger levels or rungs during the tenor of the option. When the next strike or rung of the ladder option is triggered the profit between the old and new rungs/ strike prices are locked in. The rungs of a ladder option can be structured in one or both directions to allow for greater flexibility in the option design.
For a call option, assuming that all the rungs are in one direction (i.e. all long calls), on maturity the payoff will be the maximum of the underlying asset’s price at maturity and the rungs reached, less the original strike. In effect this means that the payoff will be the maximum of a) the terminal price less the original strike or b) the highest rung reached less the original strike. The payoff will be floored at zero.
In a similar manner the payoff for a put option with all rungs structured in the same direction (i.e. all long pulls), will be the original strike price less minimum of the terminal price and the rungs reached. In other words the payoff will be the maximum of a) the original strike less the terminal price or b) the original strike price less the lowest reset strike/ rung reached. The payoff will be floored at zero.
Let us now consider the following examples. Note that we will be using a ten time step Monte Carlo simulator to simulate the future prices of the underlying asset. For further information on how to build a Monte Carlo simulator in EXCEL you may like to see the following course:
Computational Finance: Building Monte Carlo (MC) Simulators in Excel
Let us assume that you are bullish on the stock of McDonald’s Corporation (MCD). You therefore buy a one year Ladder European call option on McDonald’s Corp.’s stocks that can be exercised only on maturity. The current price of MCD stock is 90 and the original strike is set at 92. The ladder for strike resets are at 97, 99 and 109 respectively. The volatility in MCD is 30%. The risk free rate is 2% and there are no dividends on the stock.
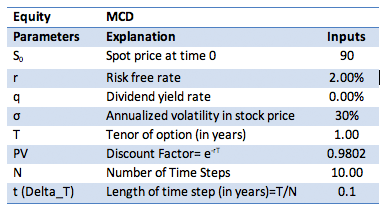
Every time the stock price reaches a particular rung the strike will be reset to the price at the rung and a profit/ payoff equal to difference between the new strike and the old strike will be locked in. For example consider the following path of prices generated using the Monte Carlo simulator:
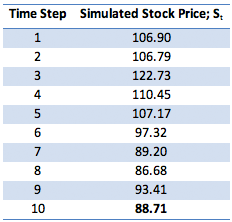
At time step 1 the stock price is 106.90. This means that the option has reached the second rung price of 99. Therefore the payoff of 99-92 = 7 will be locked in. At time step 3, the option has now reached the third rung price of 109 as the underlying asset’s price is now 122.73. An additional profit of 10 (=109-99) will be locked it. So, the total profit locked in is 17 (=7+10). The terminal price of the option at expiry is 88.71 in this scenario which is below the original strike price of 92. In a regular vanilla European call option this would have resulted in no payoff as the Max (Terminal Price – Strike Price, 0) is zero. However in the case of the ladder option the payoff for you, despite the terminal price being below the original strike price, will be that already locked in, i.e. 17.
To arrive at the result in another way consider that the maximum price in the price path series is the price at time step 3 of 122.73 which means that the highest rung price reached was the third reset of 109. As mentioned earlier the payoff is the Maximum of (Highest Rung Reached-Original Strike, Terminal Price –Original Strike, 0) or stated in another way Maximum of (Highest Rung Reached, Terminal Price) – Original Strike, floored at zero. That is,
Payoff = Max(109-92,88.71-92,0)=Max(Max(109,88.71)-92,0)
Payoff = Max(17,-3.29,0)=Max(109-92,0) = 17
The ladder call option premium is then simply the discounted value of the payoff = Payoff × e-rT
Ladder Call Premium = 17e-0.02×1 = 16.66
Using the Data Table functionality we simulate results for 100 scenarios as follows:
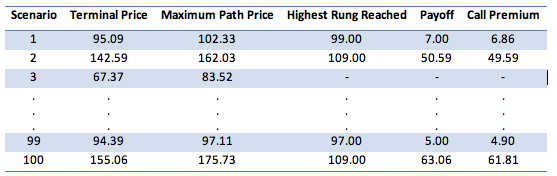
The average of all the results in the Call Premium column is the price of the ladder option obtained using the Monte Carlo simulation approach. Based on 100 scenarios this price falls in the range between 9.5-19.5. One view of the distribution of the results across these 100 scenarios is given in the following graph:
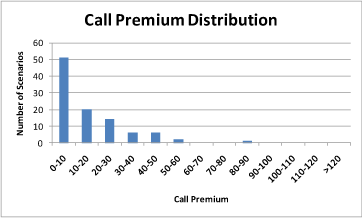
To get a more stable and accurate value or a more narrow range of results for the ladder call premium, the number of scenarios may be increased or the methodologies mentioned in the following post may be used:
Convergence and Variance Reduction Techniques for Option Pricing Models
Visit our store to purchase the EXCEL file “Pricing Ladder Options using a Monte Carlo Simulator”, a detailed numerical example of ladder call option pricing.

Comments are closed.