Session one started off with a quick review of volatility, standard deviation, value at risk and trailing correlations.
Required Download for Financial Risk Session One
The FinancialRisk-Price-data-set-Oil-Gold-Fuel Oil excel file includes raw data series for Fuel Oil, WTI Crude Oil and Gold. It also includes and shows daily return series calculations as outlined in the review above as well as a first estimate for value at risk using the variance co variance (VCV) method.
Key review points from the Financial Risk Management workshop
1. Volatility or Vol is just a fancier name for standard deviation. Within the field of risk management we calculate volatility using a relative return series. A relative return series calculates a daily, weekly or monthly relative returns using price data and then use that series as an input to estimating standard deviation or vol. Depending on the underlying data series the vol that we have calculated would need to be scaled up.
2. If the underlying data is on a daily basis, the calculated vol is daily volatility. This volatility estimate is then scaled for the appropriate period. For example for Basel II and Basel III Capital charge calculations we used a 10 day holding period. For a 10 day holding period analysis, our daily volatility would need to be scaled up to 10 day volatility. For setting trading limits for short term positions we may use a 3 day holding period and consequently use a 3 day vol estimate.
3. Once we have volatility we are ready to calculate Value at Risk or VaR. Please see the step by step review of calculating value at risk using the daily return series method.
4. For the class we only calculated VaR estimates for the WTI price series. Fuel Oil and Gold VaR numbers were assigned as take away home work for day one. If you are following this course online, please extend the sheet and the VaR estimates for Fuel Oil and Gold as shown/shared in
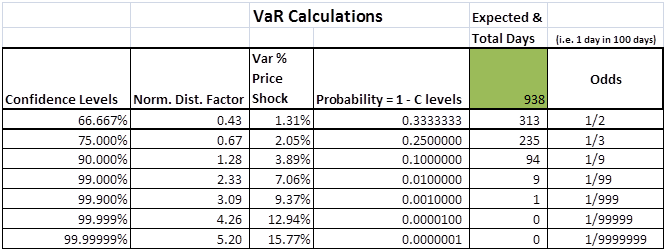
5. The output from the Financial Risk Management Workshop Excel Sheet is produced below. Please see the Value at Risk posts in the recommended reading section below for interpretation, terminology and details.
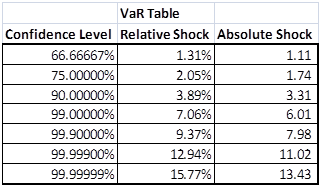
6. From the VaR table above we extracted the three column we needed for our presentation. We will use relative and absolute shock values later in the day when we present the probability of Shortfall framework. The extract below simply lists the changing relative and absolute shock levels as we change the confidence level for our VaR calculations.
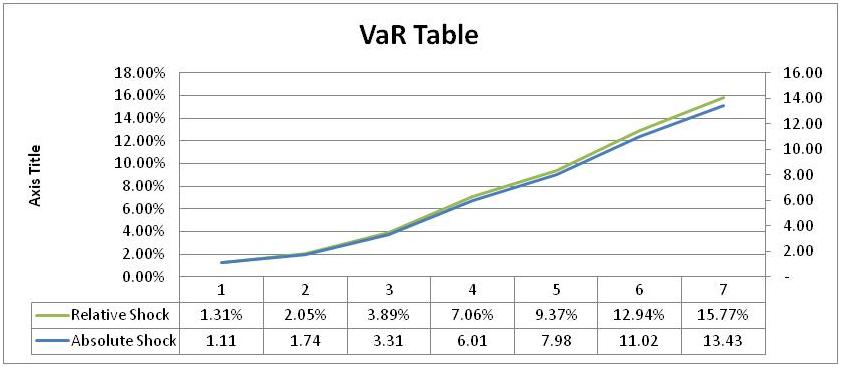
7. From a presentation point of view, it is easier to work with the VaR data in a graphical form. The class was given the assignment to produce the following graphical output.
8. So far the work that we have done only focuses on a single data series. We haven’t touched upon the role of Value at Risk in portfolio management. For the first two days our objective is to introduce the concept of Value at Risk and link this concept to the risk exposure estimation process.
9.However given the role volatility and correlation play in our analysis we also introduced the concept of trailing volatility and correlation. The recommended reading section has more details. But the next assignment in the class was producing the trailing volatility and correlations graphs show below.
10. Trailing volatility is a 9 day moving average of volatility. We use it to illustrate the fact that volatility is not constant. There are cycles and period of high stress where volatility levels jump by an order of magnitude and one of the challenges that we face in working with tools like Value at Risk is model and explain the impact of changing volatility levels and its impact on risk limits and thresholds.

11. While we have not directly used correlation so far in our analysis, in hedging as well as portfolio management correlations plays an important role. Similar to trailing volatility it is obvious from the trailing correlations graph below that correlations are also not stable over time.
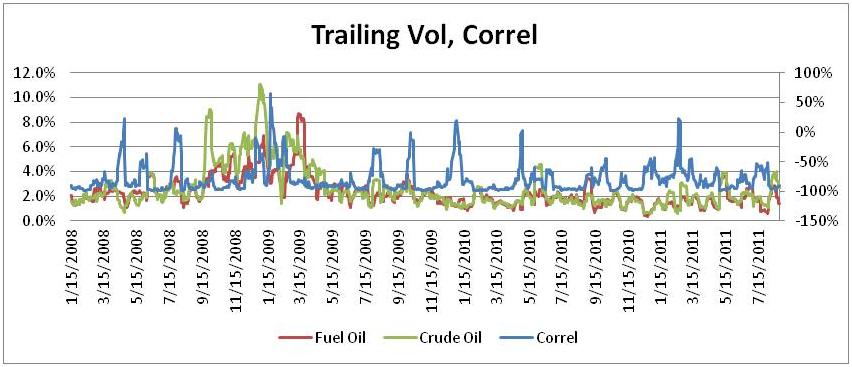
Please go ahead and produce the last three graphs above in the downloaded excel sheet before moving forward. You would need to calculate volatility, trailing volatility and trailing correlations for Fuel Oil and Crude Oil.
Homework assignment for day one included two cases. Hedging Fuel Costs at Air Canada and FX Translation and Transactions exposures at General Motors. The class was also asked to read up on the coverage of Fuel hedging for the session on day two.
(We focus on graphs because rather than tabular presentation of numbers, graphical presentation of results is more effective.)
Recommended Readings – Value at Risk
The Value at Risk Resource and Reference Guide
Recommended Readings – Commodities background
Commodities Trailing Correlations and Mispricing
Relative pricing – Linking Crude Oil and Gold –
Updates for Day Two with the data set have been posted on the main course page as well as our home page
Comments are closed.