While most customers get the underlying logic behind ALM, there is a lot of terminology floating around. The objective of this asset liability management case study is to address questions and misunderstandings around the underlying terminology by following a very simple high level example step by step.
If you come across terminology that you can’t recognize in this post, look it up on our Asset Liability Management resource page.
Here is what you will need
1. Download the Duration and Convexity spreadsheet calculator for free. Please also see the duration and convexity lessons and make yourself familiar with the concept of interest rate sensitivity before moving forward.
2. Build a simple Asset Liability Management calculator in EXCEL by following the instructions below. This will be the primary EXCEL spreadsheet referred to in this case study.
I would also recommend that you bookmark our Asset Liability Management resource page (see link above) for a quick reference on all things ALM.
Topics covered in the ALM Case Study
Here is the list of topics that we will cover in this Asset liability management case study:
- The impact of changes in interest rates on shareholder’s equity or net assets. In ALM terminology this also known as the Market Value of Equity target account or Capital at Risk target account.
- The impact of changes in interest rates on interest income. In ALM terminology this is referred to as Net Interest Income at Risk (NII at Risk) or Earnings at Risk (EAR) target account.
- The impact of funding and liquidity choices on shareholder’s equity and interest income. While the appropriate classification is maturity gaps, rate gaps, reset gaps and price gaps we will collectively refer to them as the interest rate mismatch or funding choices target account.
- Within interest rate mismatch we will focus primarily on rate or reset gaps since they drive our interest income and earnings numbers.
To simplify the asset liability management case study and the learning plan we will assume that contractual maturity of assets and the re-pricing of assets is the same in all instances. This means that the rate gap, reset gap, price gap and maturity gap are all equal and will have the same values. In later posts, we can relax this assumption.
Duration and Interest Rate Sensitivity
What happens to bank assets and liabilities (deposits) when interest rates change? Depending on the contractual language, the earning capacity of assets and the cost of deposits change. They change because the rate at which assets pay interest and deposits are serviced change. In some markets these rates are fixed, in others, they change every six months to a year. But even when the contractual rate doesn’t change the opportunity cost argument changes the fair market value of both assets and liabilities.
Rising rates change the value of any fixed rate instrument (a bond for simplicity’s sake). As rates rise bond values decline, as rates decline bond values rise. The primary measure that we use for these changes or interest rate sensitivities is called modified duration or duration for short. For simple fixed rate bonds, the higher the maturity or investment tenor of a bond, the higher its duration. The lower the maturity or tenor of the bond, the lower its duration.
On a bank balance sheet, the duration of assets is different from the duration of liabilities. Why? Because in most cases banks borrow in the short term through short term deposits and invest in the long term through long dated assets. Sometimes banks make extreme choices because of their view on interest rates, their investment strategy and policy or simply because of their risk taking appetite. When rates and markets move against them, they get wiped out.
Example One – Duration at work at 10,000 meters
For the first part of our asset liability management case study, we review a high level example. Let’s take a look at Bank A.
Our client Bank A, has $800 million in Assets funded by $ 600 million in deposits. The bank’s original capital is, therefore, $200 million. The weighted average duration of assets is 6%. The weighted average duration of liabilities is 3%. This implies that when interest rates change by a percent or more in either direction, the value of assets and liabilities will change by the respective duration (interest rate sensitivity).
The maturity mismatch, implied by duration is approximately 3 years and is not that extreme. Bank A’s crude capital adequacy ratio (CAR) at 25% is respectable by any regulatory standard.
For the purpose of this case study CAR (the capital adequacy ratio) is calculated as available capital (200) divided by Risk Weighted Assets (800).
Let’s assume that because of a drastic event and market linked shock interest rates change by 7% for both assets and liabilities. Unexpected but not unheard of. What are the impacts on asset and liability values? Figure 1 below shows the impact of interest rate changes on the balance sheet.
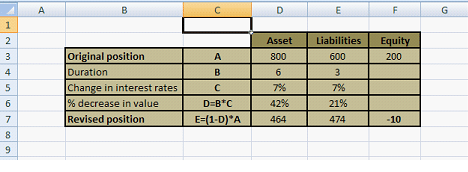
Notice that bank capital, as well as the Capital Adequacy Ratio (CAR) before the 7% interest rate shock, was quite healthy. However, the unexpected change in interest rate ate through the capital and left the bank with a $10 million hole in its balance sheet. This is because Assets fell in value by 42% percent while Liabilities fell only by 21%. That’s duration at work for you.
Even acceptable mismatching of assets and liabilities can actually render a bank bankrupt under extreme conditions. While extreme movements in rates used to be rare, they have become much more frequent in recent years. However, in the case of Bank A, even a 3% rate shock, a not so extreme change in interest rates, would cause trouble.
a. Question
Using the asset liability management case study data shared in Fig 1, calculate the revised Bank Capital and Capital Adequacy ratio if interest rates rise by 3%.
Example Two – The case of Bank A and Net Interest Income
In our second example in the asset liability management case study, we introduce the concept of maturity profile, rate sensitive assets and Net Interest Income. Our old client Bank A, has been taken over and re-capitalized and has a brand new balance sheet shown below in Table 1.
| Assets | 2,000 |
| Liabilities | 1,550 |
| Equity | 450 |
Table 1 – Bank A – New Balance Sheet
Given their recent hair raising capital loss due to recent interest rate changes Bank A is interested in finding out the impact of interest rate changes on earnings and shareholder value using an easy to use and understand framework.
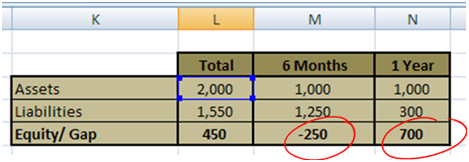
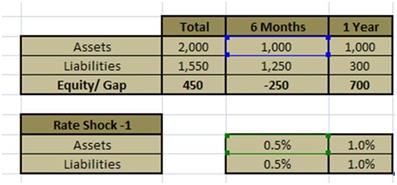
We start our analysis by first breaking down Bank A’s asset and liabilities into two maturity and interest rate reset buckets. 6 months and 12 months as shown in Table 2. In English, this means that all assets that mature or revise their interest rate before six months fall in the 0-6 month bucket. All assets that mature or revise their interest rate between 6-12 months fall in the 6-12 month bucket.
| 0-6 months | 6-12 months | |
| Assets | 1,000 | 1,000 |
| Liabilities | 1,250 | 300 |
| Rate sensitive Gap | -250 | 700 |
Table 2 – Maturity and rate reset profile of Bank A
At this point, assets earn a return of 11% per annum (p.a), while the cost of borrowing for liabilities is 6% p.a. Interest is receivable or payable on the maturity of assets or liabilities.
i. Case A – Calculating Net Interest Income – Base Case
We will now calculate Net Interest Income the Bank will earn for the full year. We will assume reinvestment at maturity of assets and liabilities in the six months bucket for another six months.
Let us assume that the roll-forwards at six months occur at the same rates, however, the interest earned in the first six months is not reinvested and is spent elsewhere.
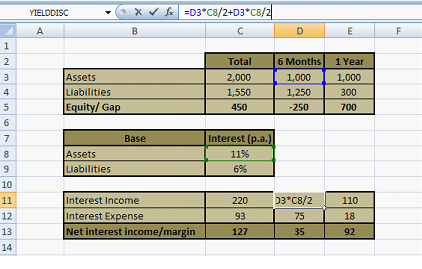
The amount in Cell C11 is $220 million. The formula is shown so that we can see the logic. The interest income for the full year is calculated across two earning periods, hence the double count below.
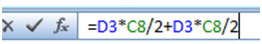
Cell D3 is the amount invested, Cell C8 is the interest rate, we divide by two to factor in the six month (of half year) investment period.
The $ 110 in Cell E11 is the interest income for one year and is simply 1000*11%=110. The Net Interest Income, net of interest expense, the return paid to depositors, comes out to be $127 million.
This is our base case scenario and in very simple, easy to follow terms it shows us the framework we use for calculating interest income and interest expense in a two choice world. A world where all assets and liabilities fall in two maturity and rate reset buckets and interest rates don’t change from one pricing interval to the next.
ii. Case B – Calculating Net Interest Income – Impact of changes in Interest Rates
Let’s step up to a more complex world.
Reinvestment Rate falls; Cost of Borrowing unchanged
Let’s assume that the reinvestment rates for assets fall by 1% while the cost of borrowing remains the same in the next six month interval.
What impact would this change have on Net Interest Income?
This is shown in figure 4 below:
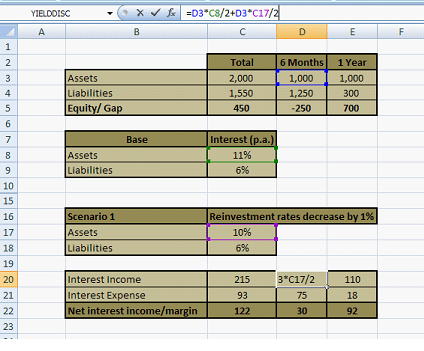
The amount in Cell C20 is $105 million. All calculations remain the same, other than the reinvestment rate for assets in the 0-6 month maturity bucket for the second 6 month investment period.
The Net Interest Income has fallen to $ 122 million (Cell C22). This is a fall of US$5 million or 3.94% ((127-122)/122).
Reinvestment rate unchanged; Cost of borrowing increases
Let’s take another instance. Suppose that reinvestment rates remain the same for Assets but the cost of borrowing at the time of recurring the liability increases by 1%. T
Then the revised situation is shown in figure 5:
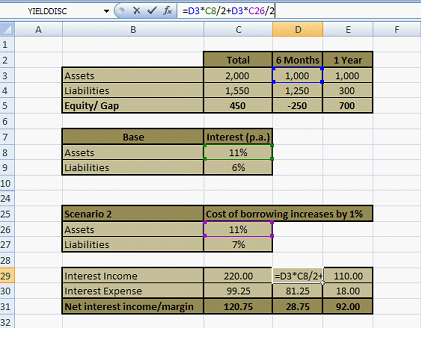
The amount in Cell C30 is $ 81.25 million. The revised Net Interest Income is $120.75 million. This time the fall in Net Interest Income is 4.92%.
Key Lessons and Takeaways from Cases A & B
a) Even if interest rates change by the same percentage for assets and liabilities the change in Net Interest Income is different.
b) Despite the fact that the rate change on deposits in the second instance (Figure 5) is the same as the rate change on assets (Figure 4), the impact on earnings is greater. Why is that?
c) In the 6 months bucket assets are $1000 million while deposits are $1,250 million. The net impact on deposits is greater. For this specific bucket net liabilities will re-price faster than assets. While in the next bucket, the 6 – 12 month maturity bucket, net assets will re-price faster.
c) When assets re-price faster and rates rise, net interest income rises. When assets re-price faster and rates decline, net interest income declines.
d) When liabilities re-price faster and rates rise, net interest income declines. When liabilities re-price faster and rates decline, net interest income declines.
iii. Case C – Calculating the impact of interest rate changes on Market Value of Equity (MVE Analysis)
While Bank A is grateful for the analysis we have done on net interest income we still haven’t answered their question on the impact of interest rate changes on market value of shareholder’s equity.
Rate shocks – Same for assets and liabilities – Variation 1
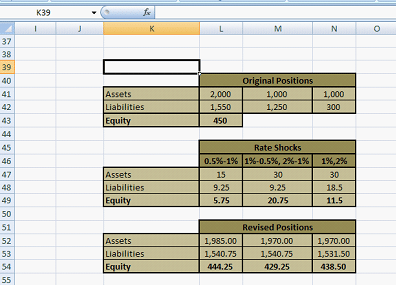
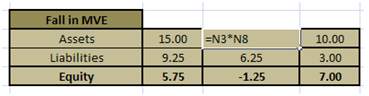
Rate Shocks come in a variety of forms. We assume a rate shock of 0.5% for 6 month bucket for both assets and liabilities and 1% shock for the 1 year bucket. The results are shown below in Figure 6.
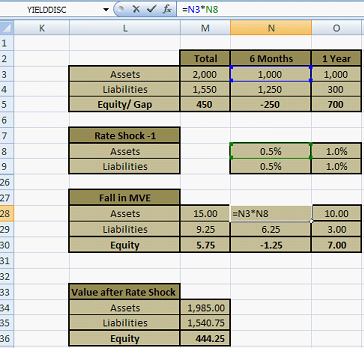
The amount in Cell M30 is $5.75 million. Asset values decline by $15 while liabilities only change by $9.25. The net change in the market value of equity is hence $5.75 million from $450 million to $444.25 million.
The change in assets and liabilities is calculated by multiplying the asset or liability value by the relevant rate shock for the maturity bucket and the respective interest rate sensitivity (duration).
Let’s do one more example.
Rate shocks – Same for assets & liabilities – Variation 2
The rate shock for 6 month bucket for both assets and liabilities is 1% while that for one year is 2%. Figure 7 presents the results.
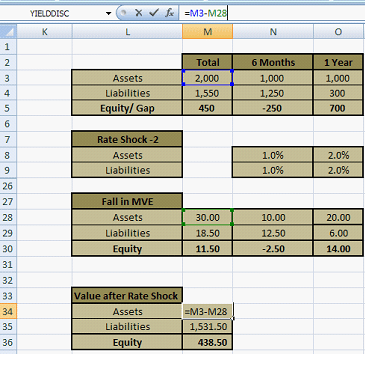
The amount in Cell L18 is Assets = $ 1,970 million. $438.50 million lower than $444.25 which is expected given that we have increased the magnitude of the rate shocks.
Now let’s add a twist to this mix.
Rate shocks – Different for assets & liabilities
Assume that the Rate Shock for assets in 0-6 months bucket is 1% and 2% for 6-12 month bucket.
The rate shock for liabilities in 0-6 months bucket is 0.5% and 1% for the 6-12 month bucket. Let’s see what happens in this setting. Figure 8 presents the final picture.
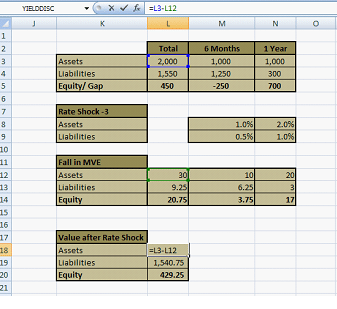
The amount in Cell L18 is $1,970 million. Shareholders’ equity is now down to $429.25 million which is much lower than the earlier values that were calculated when rate shocks were higher.
Comparing impacts
Let’s look at a quick comparison of the three cases in Figure 9.
The key lies in how the balance sheet has been structured and the funding choices that have been made. Our client Bank A has more liabilities in the 0-6 month bucket and more assets in the 6-12 months bucket as shown below in Figure – 10.
Figure 10 below presents an extract from an earlier table. We highlight the value of -250 and 700 for the two maturity buckets. (250 ) is the maturity and rate reset gap for the 0-6 month bucket. 700 is the maturity and reset gap for the 6-12 month bucket.
The impact of these choices is as under:
Negative maturity gap implies more liabilities than assets
1. In a rising rate scenario, liabilities will re-price faster and will cost more. For the same rate shock the change in the market value of assets and liabilities will net off and the sign of the change will depend on the magnitude of their difference and the sign of the gap
Positive maturity gap implies more assets than liabilities
2. In a rising rate scenario, assets will re-price faster and will earn more. For the same rate shock the change in the market value of assets and liabilities will net off and the sign of the change will depend on the magnitude of their difference and the sign of the gap.
3. Rather than doing the detailed step by step calculations, we have done here, positive and negative gaps by a given maturity bucket can be used to calculate the impact of changing interest rates on earnings (net interest income) as well as the market value of shareholder’s equity.
Homework Assignment
Is point number 3 above really true? Can you reconcile the answers presented earlier using maturity and rate gaps? Go ahead and attempt it using the data presented in the asset liability management case study above. We reproduce Figure 6 with the example of a simple rate shock impacting shareholders’ value.
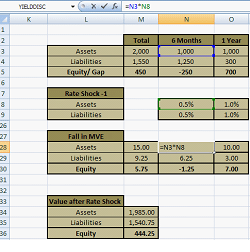
Step One: Calculate the rate or reset gap

The rate or reset gap is -250 for 0-6 months and +700 for 1 year.
The interest rate shock is a flat 0.5% for 0-6 months and 1.0% for 6-12 months.
Step Two: Calculate the change in value for each maturity bucket
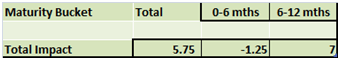
We multiply -250 by 0.5% (the first bucket) and 700 by 1.0% (the second bucket) to get -1.25 and +7. The sum is 5.75. Which is the same as our answer above in Figure 6
Go ahead and repeat these calculations for changes in net interest income.
Comments are closed.