Trading volatility across markets and asset classes.
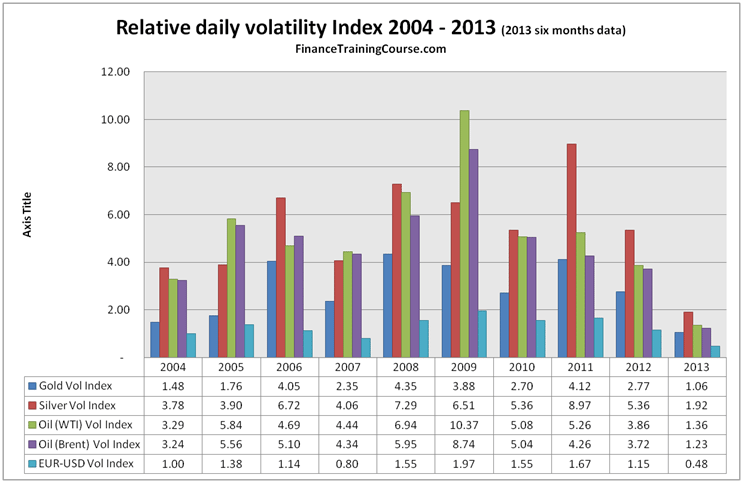
Here are questions that I recently asked in a workshop that I ran on trading volatility. Was 2004 as a year, more volatile than 2008? Was 2012 a good year for volatility? For a trader in volatility is Brent a better trade than WTI? Between Gold, Oil (Brent & WTI), Silver & EUR-USD which exposure was consistently more volatility across the last 9 years?
How would you go about answering these questions?
Three methods and their resultant charts are presented below.
a) The relative volatility index simply sums up the rolling volatility (overlapping data intervals) for a 12 month period for each of the commodities and years in question
b) The average rolling volatility method presents the average rolling volatility for all commodities and years
c) The average discrete volatility approach first calculates discrete volatility for every quarter for every commodity and then presents it as a graph
Which one of these methods do you prefer or use? Which one would you recommend for your board of directors? Which one of the following should drive trading decisions if you are an options trader or hedging decisions if you are an end user worried about price volatility? Which commodity is the most volatile? Which is the least volatile?
The data is based on daily prices from Jan 2004 to June 2013. The rolling volatilities use between 60 – 90 days of prior prices and volatilities.
Pick your answers and share them. I will go ahead and post my analysis over the weekend. Enjoy.
Relative Volatility Index – sum of rolling volatility
Average daily rolling volatility (overlapping period and biased estimator)

Average daily volatility discrete and non over lapping measuring interval
