Bitcoin Bubbles – A look at pre and post bubble price behavior
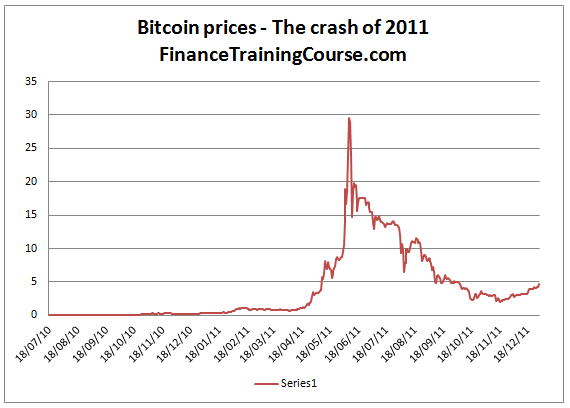
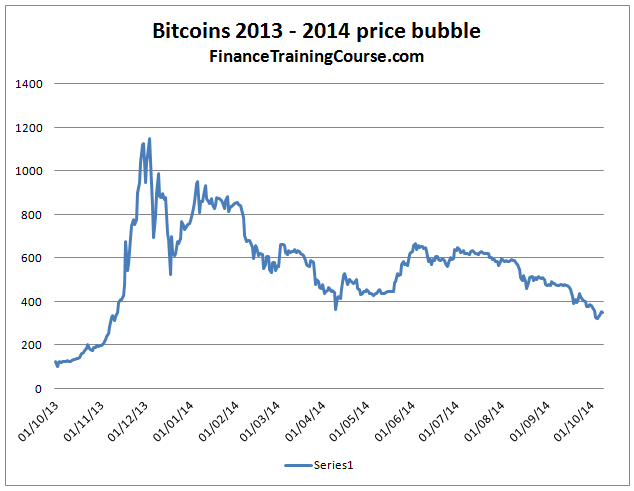
In a visual history of Bitcoin bubbles we looked price cycles in Bitcoin history and identified three distinct timelines where a Bitcoin price surge was followed by a steep price decline.
The most recent and longest cycle began in November 2013 and bottomed out in April 2014. In order of occurrence this was the third cycle. The second cycle started in March 2013 and found a bottom in June 2013. The first price cycle began in April 2011 and marked its end in November 2011.


In this post we review a few basic parameters elicited from Bitcoin trading data to put the behavior of Bitcoin prices under the microscope during each of these cycles. The objective is to answer three difference questions
- Is there a distinct difference in the number of transactions before, during and after the collapse of the bubble? This is an interesting question because if speculative growth is fueling the surge in Bitcoin prices then post the collapse of the bubble in question we should see a dramatic reduction in the number of transactions that occur in the commodity in question. If that reduction in volume in absent then perhaps Bitcoin trading is not just a select group of speculators manipulating prices but perhaps a broader group of traders.
- Is there a difference in the average price between the pre, during and post bubble period? Is there a difference in trading volumes expressed in both USD as well as BTC.
- Without a central monetary authority, is the Bitcoin network capable of a soft landing?
Bitcoin bubbles – price data
For each of the graphs shared in this section, we have subdivided the dataset into three segments. Pre bubble, bubble and post bubble. The segments are intentionally kept wide enough to document the days leading to the run up, the run up in prices itself and the collapse. Price averages are calculated over the entire period. This serves as the methodology for an initial look, we will use more sophisticated and current techniques to dissect the data in a future post.
Let begin with BTC price and BTC price volatility in US$ dataset. Here are the results.
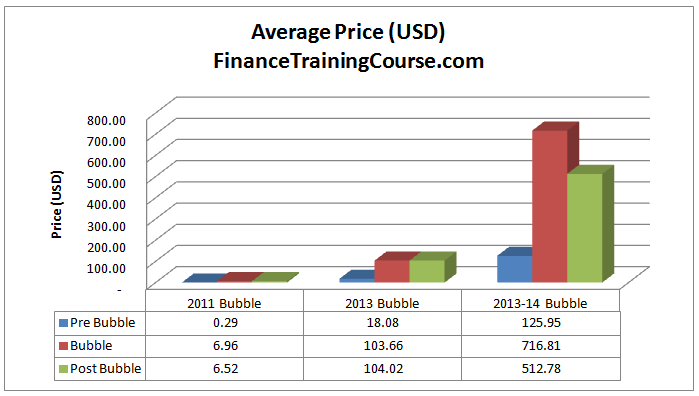
In the first two bubbles, post collapse average prices settled in the neighborhood. In the most recent bubble this was not the case. This is essentially due to the nature of the price spikes across the three bubbles. In the 2013-2014 bubble, prices went through multiple spikes. Each indicating market’s reaction to some positive development. In the first two, the number of price spikes were significantly less.
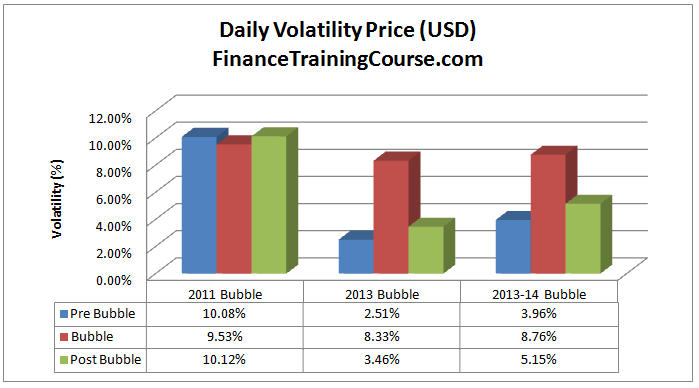
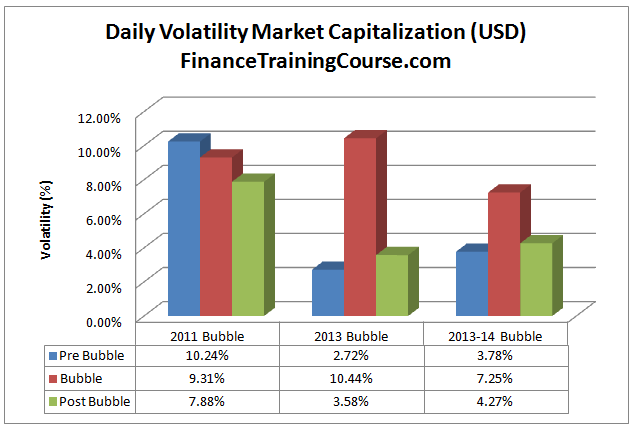
Price volatility tells a similar story. The first bubble was very well behaved, there was very little difference between volatility levels in the three segments. The second and third price bubbles not as much. There is a significant rise in daily price volatility during the bubble period followed by a substantial decline during the post bubble collapse.
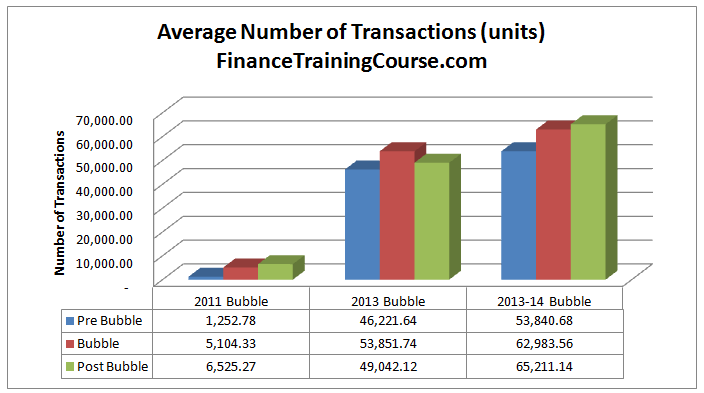
Number of transactions presents a very different view. Rather than witnessing a significant reduction in trading transactions after the collapse of the bubble, during the 2011 and the 2014 crash average volume actually went up during the post bubble period.
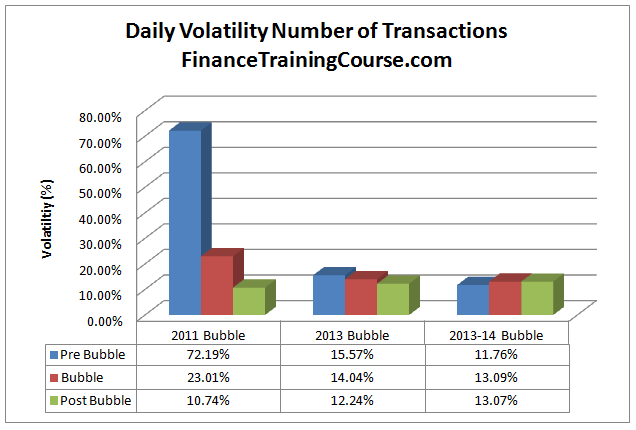
The observed volatility in number of transactions also supports this view. While there is a slight difference in volatility recorded in number of transactions across the three Bitcoin bubbles, it declines as we move toward the more recent price crashes.
This dataset represents number of transactions. Do we see a similar trend when we look at the same trading transactions expressed in BTC and USD. This bifurcation is required to highlight the exchange rate impact.
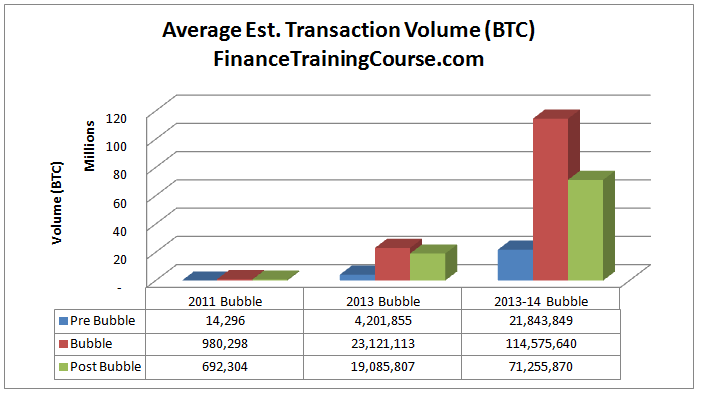
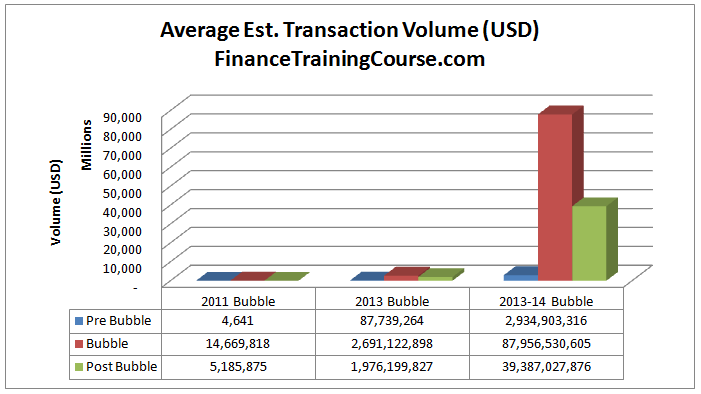
While number of trading transaction hasn’t shifted, volume expressed in BTC and USD certainly shows a significant reduction in the post bubble period. It is amplified even more for the BTC in USD dataset.
Interestingly enough average market capitalization actually rose in the aftermath in 2011 and 2013 and fell slightly in 2014.
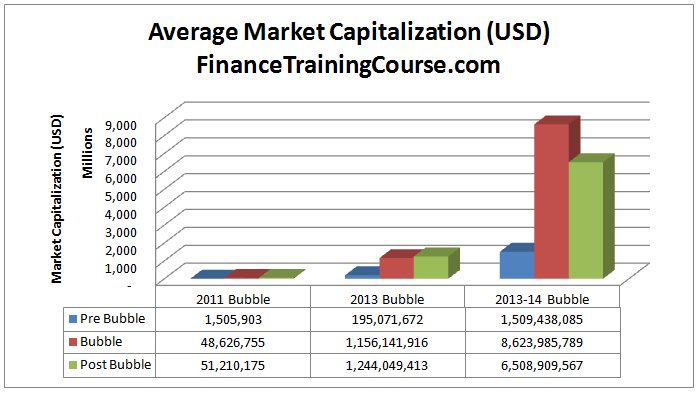
This raises some very interesting questions about the role of a central monetary authority. Central banks and regulators have always looked for ways to make soft landings possible. While trade and volume data may suggest otherwise, market capitalization data suggests that in all three instances of a price crash the Bitcoin community managed to deliver on a soft landing.
There was certainly an exchange in value but a very limited reduction in value for the market in question. Some traders and investors lost their shirts (and parts of their extended wardrobe) while those on the other side made a killing. All in all when you take a step back and look at the market as a whole, there wasn’t any destruction in value during the first two bubbles. In the third Bitcoin the market took a hit of 20% in terms of capitalization which looks more like a correction than a collapse.
The fact that the Bitcoin community was able to delivery this performance without the existence of a central monetary authority for the community raises some interesting questions. Despite the fact that we believe BTC is an independent mechanism for exchanging value, it is indirect regulatory shocks that tend to trigger panics. The panics serve as external stimuli but there is no unified measure as such within the community to reduce the impact of investors selling Bitcoins on prices. Yet the post bubble number of transactions, volatility and market capitalization all suggest that the network has figured out how to stay relevant and resilient..