If you are in a rush and need a number for Pakistan middle class estimation, just use the following figures and graph. Please feel free to use, cite or quote.
Middle class definition is households consuming more than $4 per person per day using PPP constant 2005 dollars. Methodology is applying results from Dr. Dur-e-Nayyab and Dr. Jawaid Ahmed Ghani’s respective papers from October 2011 and April 2017 to the 2017 census results. Dataset used for the most recent study is PSLM 2014. Urban, peri urban and rural divide as per PIDE Dr. Vaqar Ahmed definition. Assumes 6 people (3 adults) per household based on recent census profiles. Please see the end notes at the bottom of the page for actual citation, sources and references.
Middle class size estimation – methodology
Now that we have the numbers, citation and sources out of the way, let’s sit down and discuss the estimation challenge like civilized middle class adults.
From a market sizing perspective the size and growth of the middle class is a common point of interest in investor presentations. For applications and ideas focused on consumer markets middle class driven domestic demand has been a crude proxy for ultimate market size as well as a benchmark for attractiveness when compared to other markets. Given the significance of this number as well as its appeal to investors and partners it is important that we have a documented dated source for the actual size and definition of the Pakistani middle class.
Fortunately for the technology startup community the middle class estimation challenge has been of interest to economists much before it became a topic of interest to technology investors. There are a number of studies that pose and try to answer the question. What is the actual size of the Pakistani middle class?
The correct answer is that it depends. It depends on who you ask and your definition. There are a number of methodologies at play. They include:
- Gross percentage of total population approach, vintage 2011-2015 (38% – 42% or 82 million individuals),
- Daily household expenditure of over $2 per person, vintage 2011-2014 (6 – 12 million households),
- Smart phone ownership and data package usage, vintage 2017 (40 – 54 million adult individuals).
Credibility problems arise when numbers and statistics from different studies are put together and presented on a single platform. Seasoned investors like to reconcile figures from different point of views and if a number can’t be reconciled, it cannot be used.
Before you quote a percentage, a figure or an absolute metric it is important that you understand the timeline, the methodology and source of that figure. Investors, partners and clients are all likely to check attribution and sources. Being aware of the background makes for much more pleasant and productive conversations.
Middle class estimation – literature review.
There are two primary research papers that we referenced for answering the question. Both use the same data source. An analysis of Pakistan Social and Living Standards Measurement Survey (PSLM) conducted by Pakistan Federal Bureau of Statistics using detailed survey of 16,000 households with the support of the World Bank. The PSLM dataset is viewed as a credible and reliable data set by economists.
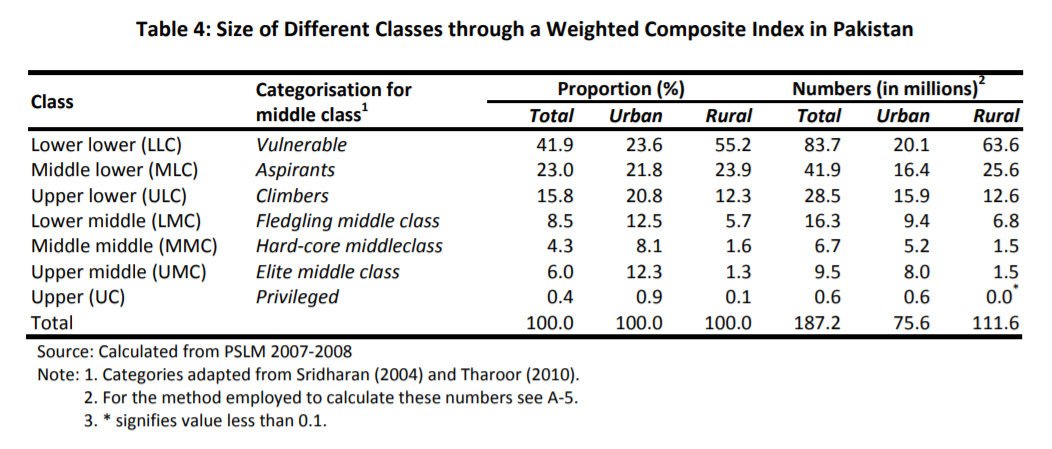
The 38% gross number that we quote above is attributed to PIDE’s Dr. Dur-e-Nayyab[1] October 2011 paper. The analysis was presented in 2011 using PSLM 2007-2008 dataset and uses a composite index comprising of education, income, housing, durable asset ownership, occupation and life style to define middle class.
If you see a 38% – 40% quoted (quite frequently by newspapers and news media) the credit goes to Dr. Nayyab. Despite the fact that the dataset used by Dr. Nayyab is now a decade old, the paper is a treasure trove of middle class analytics, composition, geographic distribution and behavior. If you are interested in middle class estimation puzzle, the paper is a must read.
If you are a student of economics and are looking for a relevant project that can create impact, stir controversy and debate, take the most recent PSLM dataset, reproduce Dr. Nayyab work using 2015-2016 survey results and publish the analysis. You will do all of us a big favor.
The most recent study using the updated PSLM data set and somewhat similar approach used by Dr. Nayyab was published by Dr. Javaid Abdul Ghani at KSBL[2]. Dr. Ghani’s study only uses daily expenditure estimates rather than using the more inclusive composite index applied in the 2011 paper.
While Dr. Nayyab’s focus was on estimating the size of the middle class, its composition, distribution and definition, Dr. Ghani’s paper focuses on how the middle class has grown over the last four decades – across the 80’s, 90’s, and the first fourteen years of the new millennium. Both perspectives are extremely important. They both clearly show that the middle class in Pakistan has consistently grown over the last three decades. Contrary to common opinions and arm chair debates, we have made significant progress in social mobility in the last 15 years.
Two key things to remember about Dr. Ghani’s study and updated presentation. There are two version of results. The first version uses a collection of PSLM data set as at 2011. The second is presented as part of an updated power point presentation and uses the 2014 dataset from PSLM. We use results from both sets here.
There are two additional studies that find their way into citations and literature references on Pakistan middle class estimation discussions. The first is the ADB study dated 2010[3] which looks at the Asian middle class as a whole. The second is the CSFB global wealth management report dated 2015. In addition to these references also see Riaz Haq’s ongoing commentary on the growth of Pakistan’s middle class.
The size of the Pakistan middle class – 2014 estimates
The most recent results quoted by Dr. Ghani are based on the 2014 PSLM data set. The numbers are adjusted on a purchasing power parity (PPP) basis using 2005 US dollars as the baseline because it allows researchers to benchmark results to the UN-World Bank-OECD purchasing power parity global consumption benchmarking study involving 140+ countries conducted in 2005.
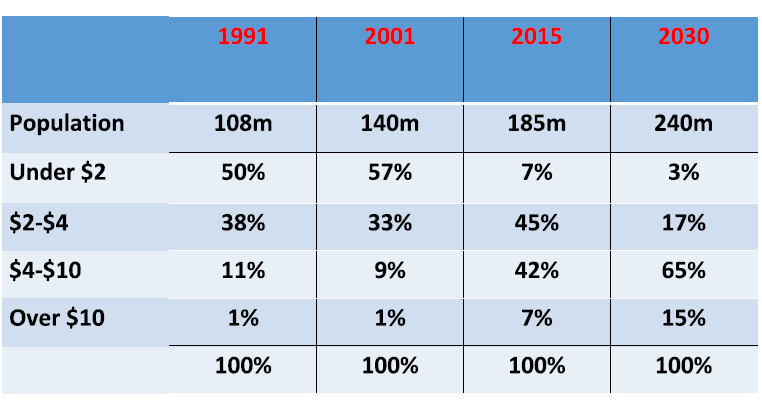
Using the $4+ per day consumption segmentation Dr. Ghani’s estimate presented in April 2017 (using the 2014 dataset) is that 49% of the Pakistani population lives in households that consume more than $4 per day per person. In the last 15 years a sizeable part of our population has migrated upwards within the social order at least defined by consumption trends.
In 2001-2002 this number was 10%. In 1990-91 the figure was 12%. By 2014 it jumped to 49%.
It is quite natural to ask how? More than 50% of the population in 1990-91 and 2001-02 belonged to households that spent less than $2 a day per person. This specific segment in 2013-14 had shrunk to less than 7%.
Clearly there has been significant upward mobility in population, including dramatic changes in consumption patterns and wealth creation in fourteen years. Especially when compared to the 1990s.
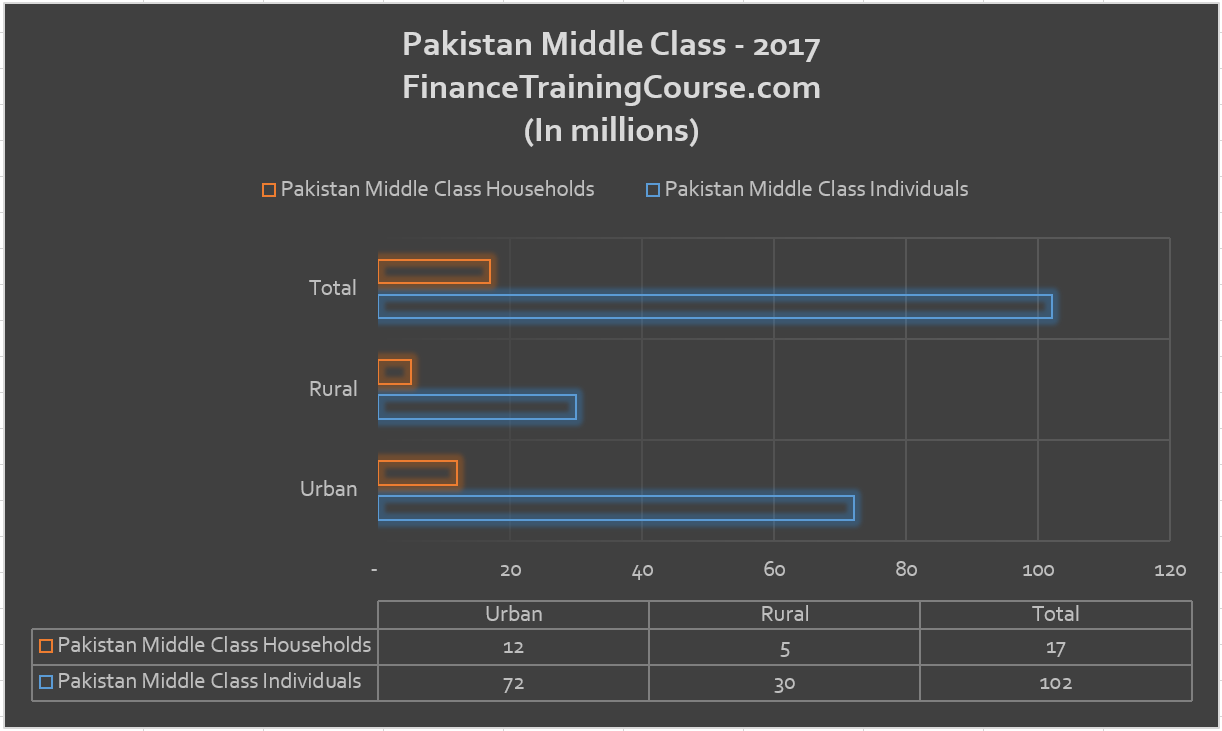
If we continue to work with Dr. Ghani’s 2014 estimates, there are about 102 million individuals in Pakistan who live in households that spend more than $4+ per day per person. Using an average size of 6 person per household that roughly gives us 17 million middle class households.
The definition and the source here is crucial. I will keep on repeating this till I am blue in the face.
The research study to cite is “The emerging middle class in Pakistan. How it consumes, earns and saves”, Dr. Jawaid Abdul Ghani, KSBL, 2014 with updated results. The source data set is PSLM 2014. The middle class definition is consumption of $4+ per day per person using PPP constant 2005 dollars.
Addressing challenges to the estimate.
If we work with the figure of 17 million households the first big challenge to this estimate is the urban rural divide. 40% of Pakistan’s population as per the recent 2017 census lives in cities. 60% lives in rural areas.
This specific statistic causes a great deal of confusion because of the 32-34 million households in the country 17 million would be classified as middle class as per Dr. Ghani’s research. What proportion of the 14 million urban and 18 million rural households get classified as middle class what proportion doesn’t? The nature of the objection focuses on the poverty levels in both cities and villages and finds it difficult to reconcile middle class consumption and composition based on anecdotal evidence.
A number of researchers and authors including Dr. Vaqar Ahmed at SDPI have addressed this specific challenge based on the 1981, 1998 and 2017 census definition of urban rural divide. As per the last three census urban areas are areas with municipal or cantonment government. Everything else is rural. The classification is not based on urban characteristics but the political and administrative governance model in place. Not urban characteristic.
So infrastructure development, schools, hospitals, markets, roads, colleges, power and telecommunication networks all marks of urbanizations don’t count for much if your town or village does not fall within a municipal or cantonment boundary as far as the census is concerned. Which means that we can comfortably throw the 40% 60% break up out of the window.
The term of interest here is peri-urban areas – areas around the periphery of cities or clusters of industry, infrastructure development and highways that have urban or urban like characteristics but are still classified as rural as far as the census is concerned.
If we club peri-urban and urban areas together the actual urbanized population estimate for Pakistan jumps up to 70%. Which means the actual urban rural divide is 24 million urban and peri-urban households versus 10 million rural households.
17 million middle class households from this classification is a lot more believable than the earlier 40% – 60% split the last two census have quoted.
To get the actual distribution of households between urban households versus rural households we have two choices.
We can assume that the proportion documented in Dr. Nayyab’s study hasn’t changed. Which gives us a distribution of 64% urban versus 36% rural. Or we can just apply the urban, per-urban versus rural split of 70% and 30%. Given the clear rise in urbanization over the last 15 years, the second option is more likely. It gives us 12 million urban middle class households versus 5 million rural households.
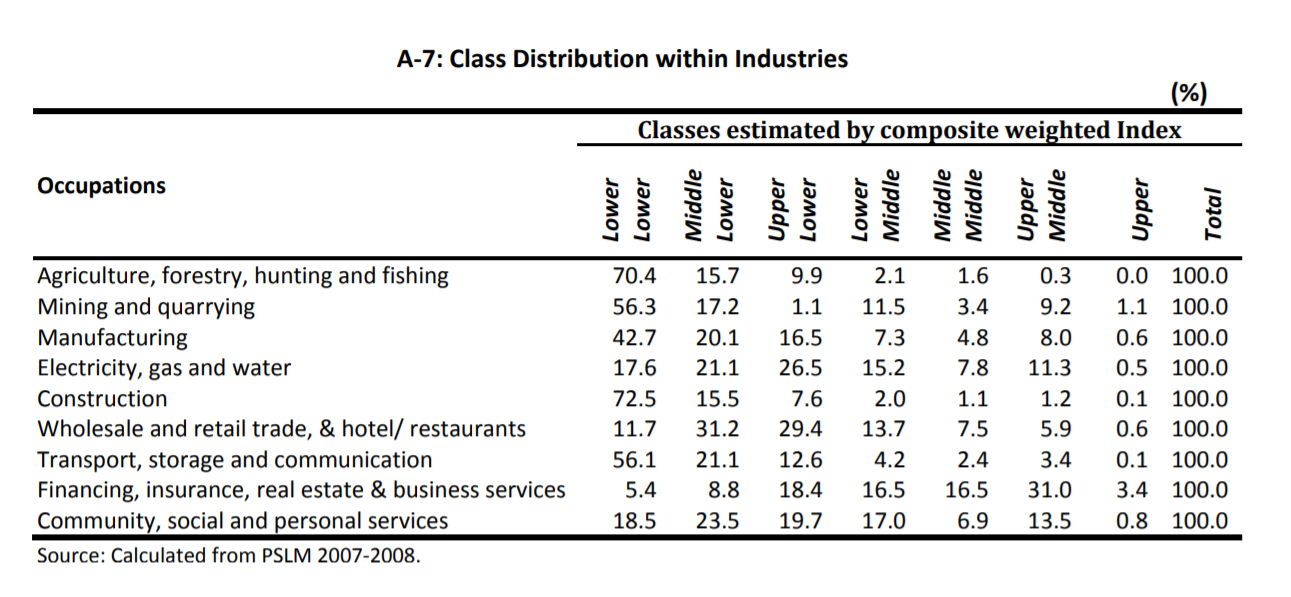
Dr. Nayyab’s original paper also looks at the distribution of the middle class by occupation. That analysis further strengthens the basis for 2017 estimates. Which are the two sectors that have benefited most in terms of growth over the last 17 years. Broadly speaking services but within services specifically retail trade and financial services.
Take a look at the image below from Dr. Nayyab’s study. Where occupations had the largest concentration of upper lower, lower middle and upper middle segments in the 2007-2008 data set?
References and sources
For the discussion that actually triggered the middle class size estimation debate please see – Pakistan Technology sector Infographic
[1] See the original paper at http://www.pide.org.pk/pdf/Working%20Paper/Middle_Class_Nayab.pdf as well as follow on commentary at http://www.thefridaytimes.com/tft/a-downer-on-pakistans-middle-class-data/
[2] Please see – http://iba.edu.pk/testibaicm2014/parallel_sessions/ConsumerBehaviorCulture/TheEmergingMiddleClassPakistan.pdf
[3] The rise of Asia’s Middle class – Asian Development Bank, 2010 – https://www.adb.org/sites/default/files/publication/27726/ki2010-special-chapter.pdf