Recent years have seen an increase in the volatility of oil prices. This should not come as a surprise; the prices of oil are dependent upon several external factors, only some of them economic in nature. In this post we review a visual model that we have presented earlier on this site with an updated 2013-2014 data set. But rather than focusing on the model building process we devote our attention this time to the visual images and the relationships they depict.
Forecasting crude oil prices – data set sources
For our analysis we borrowed most of our data from U.S. Energy Information Administration (EIA). OPEC surplus capacity, OPEC and world crude oil productions, OPEC and world crude oil production, historical crude oil pricing data, predicted crude oil prices data and futures contract prices are all obtained from the EIA’s database. The historical S&P index is obtained from Yahoo Finance. And the USD-EUR exchange rate is obtained from oanda.com.
Crude oil price forecasting –
Price Trends
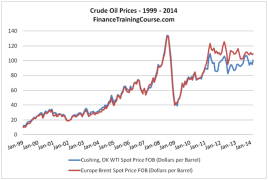
Figure 1: Historical crude oil prices
The new millennium had witnessed an unprecedented increase in the volatility of oil prices, with the past decade containing both the highest numeric increases and decreases of crude oil prices. We have also seen remarkable convergence and divergence between WTI (the North American pricing bench mark) and Brent (the European pricing benchmark) in the last 15 years.
US$ exchange rate volatility and crude oil pricing
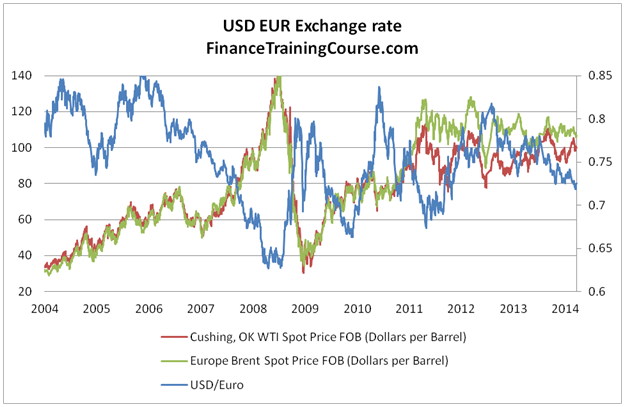
Figure 2: US $-EUR exchange rate
Pre 2009 US$ weakness and the strength of Euro sparked a very different debate. Europe wasn’t really paying higher oil prices since all oil had done was incorporate the exchange depreciation impact of US$. Post 2008 with the arrival of the financial crisis on the scene and the resultant fall out on PIGS (Portugal, Ireland, Greece, Spain) created enormous pressures on Euro and ECB. The ease of reallocation of investment shaped a significant negative relationship between the prices of crude oil and the strength of US dollar as well as Euro. Weakened dollar breeds insecurity motivating investors to explore commodity markets in search for better, sustainable stores of value.
Crude Oil Price Forecasting Models – The Supply side equation
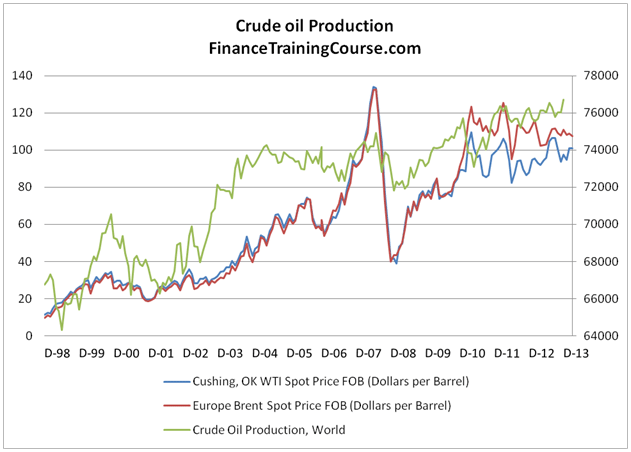
Figure 3: Global crude oil production
Producers moved to maximize producer surplus, therefore, an increase in prices was followed by an increase in production and vice versa. The peak in 2007-2008 resulted from the limited production capacity and the elevated consumers’ demand.
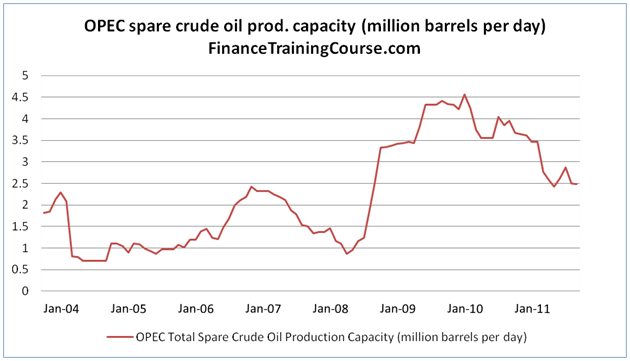
Figure 4 OPEC spare production capacity
Crude oil price forecasting model – Global demand for liquid fuel
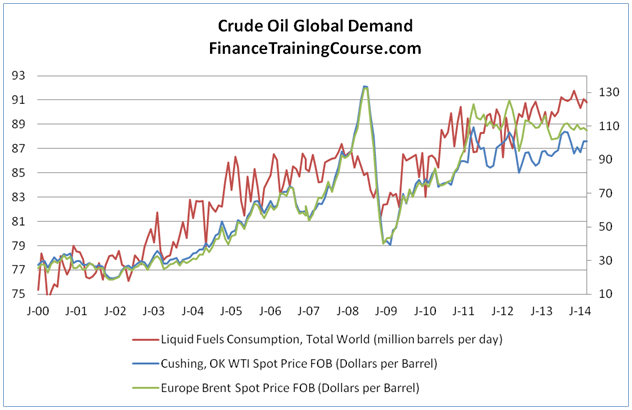
Figure 5: World demand
Higher demand pressured prices into rising above historic marks. Demand was attributed to development of world economies specifically China. A drop in demand post the 2008 financial crisis also led to the price collapse that happened in 2009.
The Global recession 2008-2010
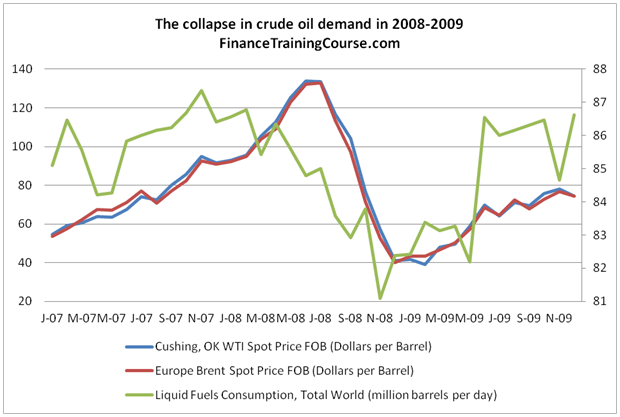
Figure 6: Crude oil prices and world consumption during recession
Recession stifled the demand of oil in the world, as economic environment discouraged spending. The move towards a new stable equilibrium of supply and demand forced a free fall of crude oil prices with prices falling by over $80 per barrel within a year.
The correlation with equity markets
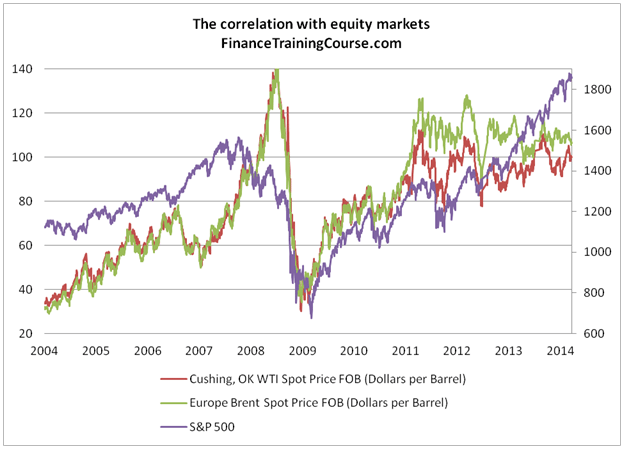
Figure 7: S&P 500 index
Value of S&P 500 index is occasionally taken as a proxy for future economic growth; with an improving economy, investors became bullish on crude oil and derivative products and vice versa. The relationship disappeared post 2013.
Crude Oil price forecasting model – The spread between spot and future contracts
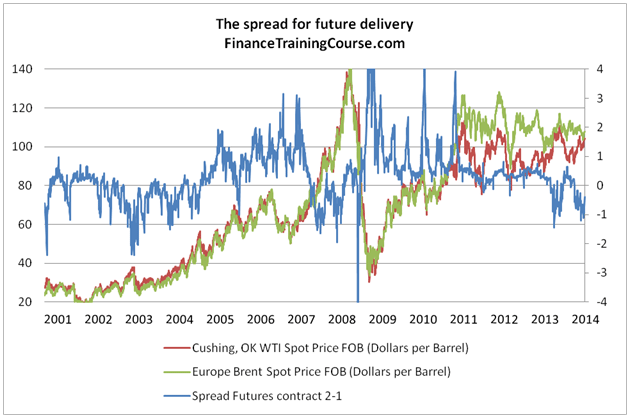
Figure 8: The Futures Contract 2 – Futures Contract 1
The spread between future contracts may possibly be used as a leading indicator of future demand.
Crude oil price forecasting model – WTI and Brent spread revisited
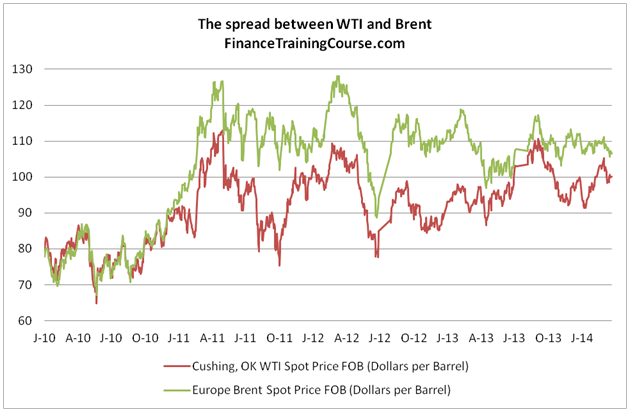
Figure 9: The increasing spread between Brent and WTI prices
The high transportation cost of crude oil used to compensate for the spread between the prices of WTI and Brent; however, growing capacity of pipelines to move crude oil decreased the transportation cost of WTI, which powered (US) Gulf Coast refiners to completely forgo crude oil imports, thus, creating the spread.
The model for future expected prices
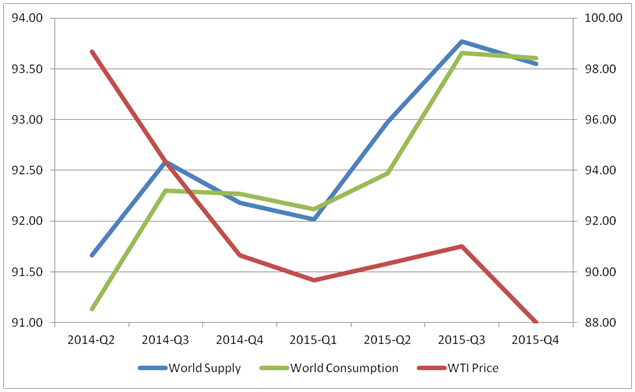
Figure 10: Expected Equilibrium and its impact on prices.
Decrease in the number of outages and increase in the capacity will result in a reliable supply of crude oil from the non-OPEC countries which will more than compensate for the expected fall in OPEC supply. Restoration of supply from Libya and Iraq as well as the status of the US as a net exporter of fuel products will impact the global pricing equilibrium. While a few years ago, peak oil supporters would classify the following as blasphemy, more and more analysts are now talking about sub $50 dollar oil.
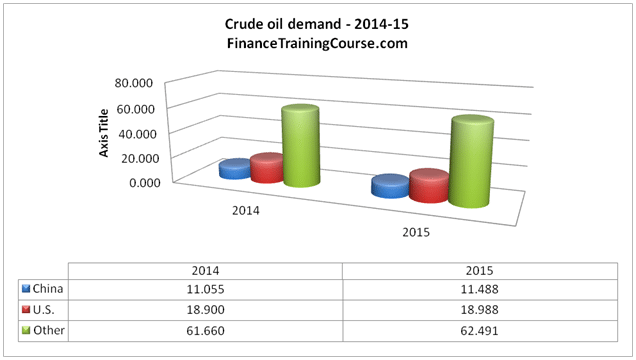
Figure 11: Expected demand (millions of barrels)
While demand is expected to increase, the lower growth rates of China, Europe and Africa have resulted in a subdued increase. Continued increase in the usage of natural gas and coal consumption in electricity production could further ease the demand side pressure.
What do you think? Do you think Crude is likely to break the $50 barrier in 2015?