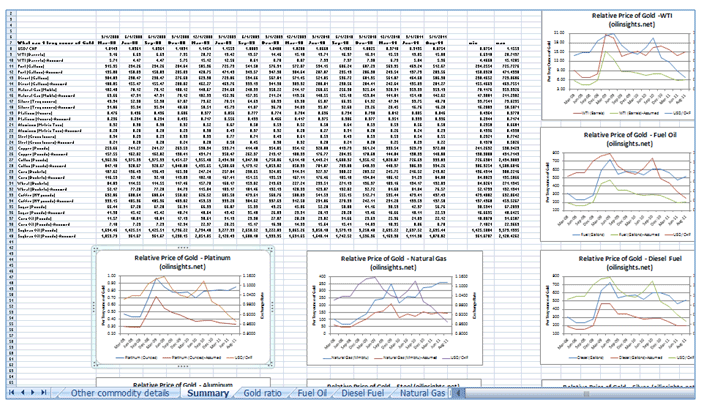
The relative gold price model, presented in MS Excel worksheet format, assesses the relative value of Gold against that of other commodities. It is used to:
- Highlight trends in the relationships between gold and a given commodity
- Identify points when relations broke-down or when a new “normal” was created. This may be due to new drivers influencing one or both commodities.
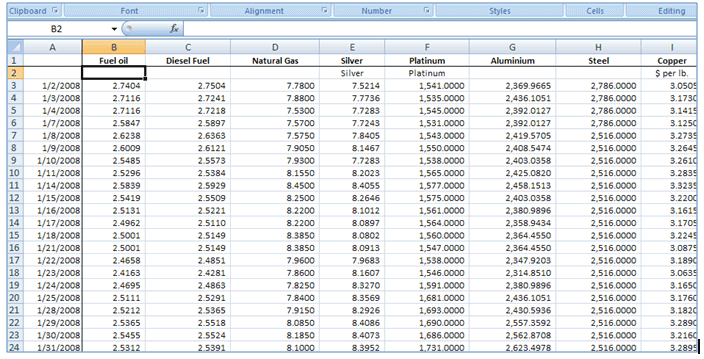
The data used in the analysis is spot price data for the period January 2008 to August 2011. The data was obtained from a number of sources in particular:
- Gold Spot Price Data from www.onlygold.com. This price data represents the London P.M. fix spot price which is the price at which the world’s largest size gold purchases and sales are accomplished on any given day. The price is expressed in USD for 1 troy ounce of Gold.
- West Texas Intermediate, Cushing, OK, Spot Prices, expressed in USD for 1 barrel of Crude Oil from eia.gov.
- Other cash commodity prices from the Market Data resource of the Wall Street Journal. These prices reflect buying and selling of a variety of actual or “physical” commodities in the marketplace. The commodity details are as follows:
| Commodity | Details |
| Fuel oil | Fuel oil, No. 2 NY gal. |
| Diesel Fuel | Diesel Fuel, 500 ppm S, NY harbor low sulfur |
| Natural Gas | Natural gas Henry Hub, $ per MMbtu |
| Gold | Gold: American Eagle, troy oz. |
| Silver | Silver: London fixing, spot price, per troy oz (expressed in GBP) |
| Platinum | Platinum: free market |
| Aluminum | Aluminum, LME $ per metric ton |
| Steel | St. Steel scrap, US, $ per gross ton-D |
| Copper | Copper, high grade: Comex spot price $ per lb. |
| Cotton | Cotton, 1 1/16 strand lw-md Mmphs, per lb |
| Corn | Corn, No. 2 yellow. Cent. Ill. Bu |
| Wheat No.1 | Wheat, No. 1 soft white, del Portland, Ore |
| Coffee | Coffee, Colombian, NY lb. |
| Sugar | Sugar, cane, raw, world, lb. fob |
| Corn oil | Corn oil, crude wet/dry mill |
| Soybean oil | Soybean oil, crude; Central Illinois lb. |
For each data point (days) in the data set, the relative value ratio is calculated as:
Price of Gold/Price of Commodity
With the exception of silver the remaining commodities, like gold are expressed in US Dollar for a given unit of that commodity. Silver has been expressed in UK pound sterling. In order to make a meaningful comparison between the price of gold and the price of silver and to calculate the ratio as given above a further adjustment is needed to first convert the Silver spot prices at each data point to USD, using the relevant USD/ GBP exchange rates (www.oanda.com) for those dates.
This ratio gives the answer to the question:
“How many units of a Commodity can 1 troy ounce of Gold buy?”
For example a screen shot of the excel sheet calculation for Sugar is given below:
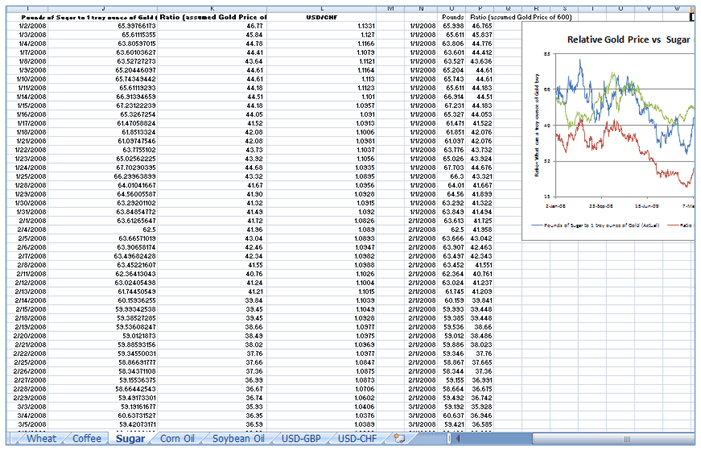
The graph derived in these calculations is as follows:
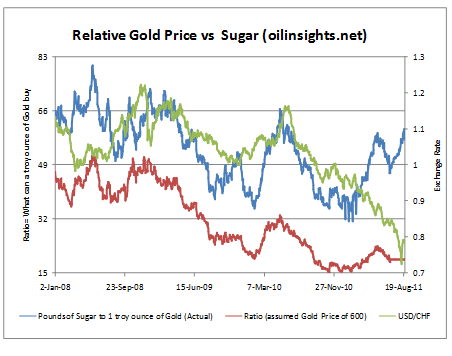
The blue line presents us with the answer to the question “How many pounds of Sugar will one unit of Gold buy?” As of 24-August-2011 the answer was 57 pounds of Sugar.
In addition, to this analysis which is based on the actual prices of gold in the period of analysis we have also plotted and assessed Gold’s relative price if its price had been held at a constant rate of USD600 over the period of analysis. The resulting time series for the derived ratio was then compared to the trend in the historical USD/CHF exchange rates (www.oanda.com) over the same period of study to see if all or part of Gold’s appreciation or depreciation could be explained by the appreciation/depreciation of the US Dollar, in this case against the Swiss Franc.
This is illustrated for Platinum below in summary form:
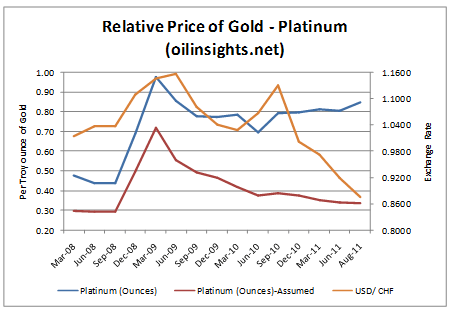
The red line gives the assumed ratio given Gold price is held constant whereas the orange line is the historical plot of the USD/CHF exchange rate. We can see to some extent the depreciation in the assumed value of Gold is linked to the depreciation in the US Dollar against the Swiss Franc.
The excel file provides similar analysis for all 17 commodities in the data set presented separately with detailed calculations as well as graphical representation. It also presents the results in a summarized format both as a table of results as well as monthly average graphs for each quarter in the study.
To see some of the analysis put into perspective and action you may like to review the following articles:
Our relative gold price model is now available for sale. To purchase the Excel file visit the Computational Finance section of our Finance Course Store.
Comments are closed.