Considering embarking on the road to entrepreneurship? Clueless about financial modeling? Let’s take a quick look at financial modeling for startups. We highlight key terms and concepts some of which we will visit later in future posts.
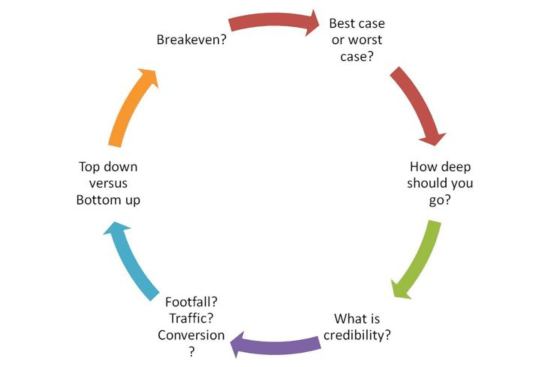
We begin by asking the following questions:
- Should you focus on the best case or worst case scenario for your financial statements?
- How deep should you go in your analysis?
- What is credibility and how is it achieved?
- How do footfall and ticket size apply to financial modelling?
- What are top-down and bottom-up approaches to financial modelling?
- What is the Break-Even level?
- What should your final financial statements look like?
Financial Modeling Basics
For a start up, financial modeling is essentially developing financial statements for a future business which you wish to undertake. We generate or project numbers that form profit, expense, capital and revenue statements.
Your credibility as a founder is defined by how well you understand the nature of your business and knowledge of the drivers that control it. Your projected financial statements help convey this to investors.
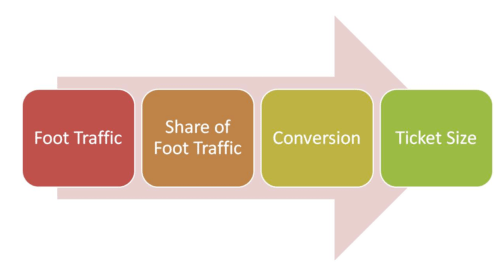
For a retail or e-commerce business the first step in drafting your projected financial statements is to determine the expected footfall and conversion rate, i.e. the number of customers expected to land on your domain/site/shop/store front and the percentage within these who will convert and purchase something.
There are two approaches to do this. The first is a top-down approach. Suppose you are selling clothes for children. The client-base is 3 million households in the region of the city you are planning to operate in. Assuming each household has only one child and that only one out of every three households will actually buy an item of clothing within your projected time period, e.g. 3 months. Add additional filters that could impact your client base such as competition, affordability, access, reach and your own capacity to serve and sell. However not every one who lands at your shop will convert. Not all those who arrive at your outlet will purchase clothes.
At the most simplest of levels the conversion rate is that rate at which prospective customer purchase. For a typical e-commerce store this figure will range between 0.1% of traffic to 2%. An category leading brand such as Amazon.com will routinely convert 2% of its traffic. As a new store or entrant you would be lucky to convert between 0.05% to 0.2% of traffic. Please note that conversion here implies a purchase. Customers may convert in other ways – by signing up to your mailing list, by downloading a coupon for a future purchase, by browsing a specific category on your store. So if you attract a million visitors a month in traffic and 0.1% of these visitors convert, your projected sales transactions will be:
1,000,0000 x 0.1% = 1000 orders per month
This approach is called a top down approach. We estimate traffic and apply a general conversion rate to estimate sales over a given period of observation.
The second approach is the bottoms-up approach. With this approach we begin with how much we need to generate in sales every month or quarter.
For instance, you are planning on opening a restaurant and projected fixed expenses work out to $2000 per day. If you sell 100 meals at $50 per meal with a profit margin of $20 per meal your margin contribution from sales would equal your expenses. This is your break even level. From every meal $30 would go to the meet the cost of the meal being served – which is a variable cost. The remaining amount, your profit contribution can go to meet your fixed costs of $2000 per day.
The 100 sales a day at a price point of $50 and a contribution of $20 per meal is your break event point.
The break even level is the output at which fixed costs equals contribution resulting in a net profit of zero. Out of the two approaches, the bottom-down approach is more credible because it is more realistic and based on actual transactions. It requires you to build a transaction model that clearly tells you that on average a meal at your tables will cost $50 (who can spend $50 per meal – your customer profile), that it will generate $20 in contribution (a break down of the cost components of the meal) and that this amount generated by a 100 meals per day (how many meals per hours and a table utilization model to predict the amount of space you need to serve 100 meals per day) will cover your fixed expenses (a model of fixed expenses).
In the example above $50 per meal is your average ticket size. To determine profitability you need to compare ticket size with the cost components for the average transaction. If we can’t serve 100 meals a day then the ticket size of $50 per meal and the contribution margin of $20 per meal is clearly not sufficient for our business to survive. We need to either increase prices (price point), reduce fixed expenses (cost rationalization) or increase the number of meals (sales volume) served per day.
This means that we need a clearly defined transaction model with cost components and market driven profile. If the average cost of a meal served in other restaurants and delis in our neighborhood is $20 (competitive intelligence) and we are pricing ourselves in at $50 (competitive disadvantage) there is most likely going to be an issue.
Your transaction model determines the value added at each step from raw material (purchasing meat stock and vegetables) to work in progress (dicing, cutting, slicing) to production (cooking) to inventory (fridge, freezer, oven) to packaging (plating) to sale (served on the table). Add value at each step to cover costs and profit margin.
A good model should be able to project both best case and worst case scenarios side by side with a realistic base case. A good model should be flexible enough to analyze the impact of targeting a specific customer segment (different price points and demand models). You should be able to test price tolerance or purchasing frequency (customer segments and profiles) and its impact on your final results.
Financial Model Insights
After determining the average market transaction and its components you need to define your capital needs. A simple approach is to estimate the time to break even – you are not going to start with serving a 100 meals on the first day. Once you have the time to break even you need to estimate the cash short fall you would need to fund till break even is achieved. To this figure add your startup, launch and marketing expenses and you have a ball park figure.
Even if you think that break even will be achieved in six months, it is advisable to plan a launch runway. A launch runway is the time frame you use for pivoting, experimenting and utilizing capital. Essentially for making mistakes and recovering from them. A ball park figure is planning for a year of expenses ignoring the amount of projected sales. Even with projected expenses it is always preferred to add a margin for slippage – for the contingency that actual realized expenses will slip past planned thresholds.
It is import to determine the time-to-breakeven on a cash basis; not on an accrual basis. Time-to-breakeven on a cash basis is the time taken for net cash-flows to turn positive, whereas on an accrual basis costs and revenues are assigned to a stated period whether actual payments were received or not.
Facing investors
The presentation layer of your financial model should be as simple, summarized and concise as possible. Ideally the front end should be limited to 5 – 10 line items spread over 5 years with the ability to drill down to a specific line item or year for additional details.
Investors switch between Macro (high level) and Micro (detail level) views during presentations. Depending on their style of analysis they may first do a macro review followed by a micro session or do a combination of both. Focus on and begin with the big picture. Be prepared to explain, defend and change your assumptions on the fly. Keep an open mind to challenges to your model and to exploring alternate models and strategies. As an investor I like nimble founders versus founders who are married to a given world view.
For the model you can start off with a simple spreadsheet containing a separate section for assumptions (e.g. discount rate, inflation rate, revenue growth, etc), a revenue model and an expense model. The latter two are transaction based. Project the revenues and expenses to determine the net profit or loss for a number of years.
Credibility requires more than just a presentation of numbers; you must be able to defend your figures. This requires an insight into the nature of the business and an understanding of projected figures.