Calculating Exposures for Risk Hedging. Approaching risk assessment, analysis and estimation
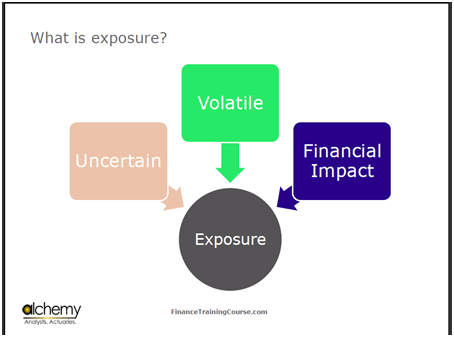
When we talk about exposure, it has three dimensions for us. It is uncertain, volatile, and has a measurable financial impact. In Air Canada’s case, the exposure is to the following 3 items: fuel, interest rates, and foreign exchange rate.
Within risk, the biggest difficulty is not to know where you are exposed, but rather, the amount by which you are exposed.
For example in the GM case, GM is exposed to X billion dollars, but it also has cash. So when we net out the numbers, the exposure is much less. In Air Canada’s case, it plans on hedging itself between 8%, 30%, 35% or 75% because even though its exposure is high, the impact that it will have on its finances can be managed between 8% and 75% and it, therefore, does not need to hedge itself completely.
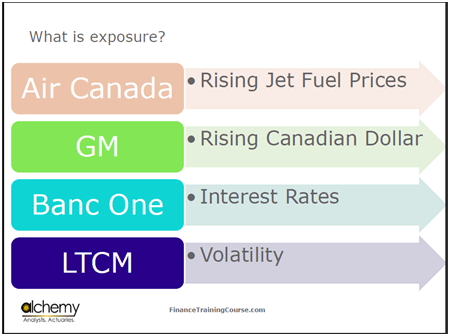
These are the four cases that we will look at.
- GM is concerned with rising Canadian Dollars because its reporting currency is the US Dollar.
- In Air Canada’s case, the exposure is to rising jet fuel prices.
- In Banc One’s case, the exposure is to changes in the interest rates, and
- In the Long Term Capital Management(LTCM) case, the exposure is to changes in long term volatility.
Risk Assessment and Analysis: The role of risk policy
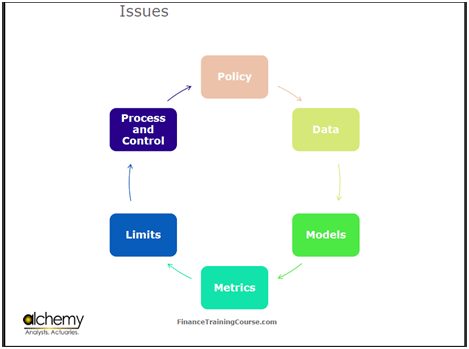
Within the setting of a Board, there is generally a document which states the method of managing a particular exposure or a given type or class of risk. This policy document relies on three things. Firstly, it relies on data. For example in Air Canada’s case, the data was the price data and the amount of fuel that Air Canada would consume in both good and bad times. Secondly, the document relies on a model. We have previously produced a model which allowed us to see how the numbers coming out of the data were interacting with each other. What we tried to produce in previous efforts was the probability of a negative margin or the probability of a short fall occurring. Thirdly, the document focuses on the metrics.
A policy document also says that it is in the best interest to ensure that things remain within the company’s range. When you will look at the Banc One case, you will see that the bank wants to limit earnings sensitivity to changes in interest rates to about 5%. In all of these cases, you will also see instances of limiting interactions with different counterparties to a limited amount. As we move forward, you will see that more limits keep coming up.
Finally, the last piece is process and control. For instance, a company will not hedge more than 75%, but if volatility rises or its simulation model indicates that its shortfall has risen by a great amount, then the company will review it.
This entire process is risk management. The exciting piece in this is the model. The boring piece is the policy. The painful piece is process and control. When you talk about the philosophy of risk, all of these elements are included in it.
Risk Assessment and Analysis: The Limit Management Framework
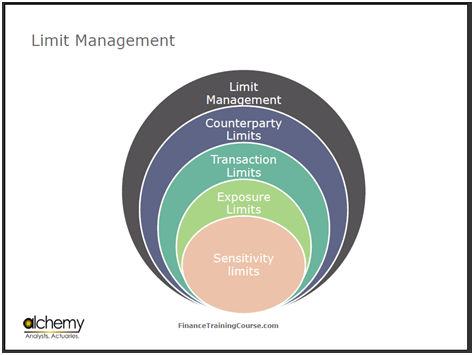
Process and control focus on the fact that there is a desired behavior that has been specified in the policy. That desired behavior should not become undesired behavior. We control this by making sure that whatever thresholds have been specified are held true. The Limit Management framework has many pieces. Assume that I am Air Canada. I deal with Goldman Sachs, Merrill Lynch, and the Union Bank of Switzerland. What portion of my business should go to all three of these? When I interact with them on transactions, do I give everything to Goldman, 50% to Merrill, or 10% to UBS? How do I find out these fractions? A Counterparty Limit is there precisely for these questions.
Then there is Transaction Limit Piece. On each transaction piece, individuals and businesses have a limit. For instance, officially, I shouldn’t be allowed to gamble more than $10 a time, and you shouldn’t be allowed to gamble more than a dollar a time.
There is also an Exposure Limit. For example, under no condition will our exposure to a certain currency exceed 3,4, or 5 hundred million dollars. When that happens, we have to hedge it. Another example would be of the fact that under no circumstances will we be exposed to a movement in any currency of more than $ 5 million. If Banc One says that their earning sensitivity to changes in interest rates should be less than 5% is an exposure limit.
The final and the most interesting piece is what we call sensitivity limits. Remember in the GM case there was something called a delta exchange? A delta exchange is an indication of a sensitivity limit. When you will do the LTCM case, you will see a full range of these limits being implemented.
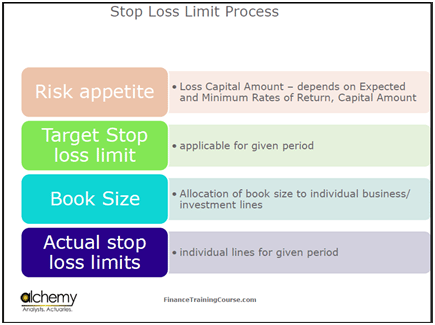
What do you do when a limit is breached, or how do you decide where a limit is set? You decide it based on your appetite. Your appetite is a function of what you can afford to lose. Think about a large bank with a few billion dollars in capital and a few hundred billion dollars in assets. This large bank has thousands of positions, limits and counterparties. All of these add up to an amount, which is called the risk weighted assets. There is a very simple ratio which you use when you look at these assets with the amount of capital that you have. We call this ratio the Capital Adequacy Ratio or CAR for short. The idea is that when I set limits, I do not set limits in isolation.
Yes, I can afford to lose a hundred dollars, but does that mean that on every bet I risk losing a hundred dollars? If I want to make 10 bets, do I make one bet of a hundred dollars or 10 bets of 10 dollars each? I am restricting the amount I am betting based on the amount of capital that I have in hand.
Now to the third piece that comes into play here.
When you are a participant in the market, there are certain expectations from you as a player. On a daily, weekly or monthly basis, a certain share of what happens in the market will flow through your books. Based on that side, you also need to figure out whether you want to take new exposure or you don’t. What happened to the Lehmann Brothers and to Bear Sterns? You all understand what a broker is right? A broker is someone who sits between two counterparties and helps them settle their paperwork by taking care of settlement, confirmation, exchange etc. Think of it as a post office box where money comes and goes. As long as a broker is stable, he can survive. But the minute that there is even the smallest of doubts that the broker is not going to survive, people will stop clearing and settling through him. When they stop clearing and settling, the core business goes away, and the broker also has a big issue with liquidity. Thus, the Book Size piece requires you to maintain a certain stature in the market so that the people that you deal with on a daily basis have no doubts. But if you still want to limit your exposure, you can actually cut your limits in an orderly fashion in such a way that you are on the receiving end of receiving cash, and not paying cash.
Going back to our discussion about risk, we listed Policy, Data, Models, Metrics, Limits, and Process and Control.
A Target Account is something which you use and manage to run your Process and Control.
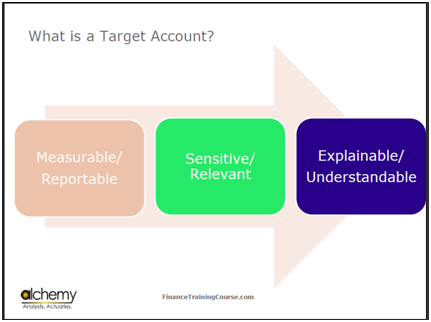
It is something which you track. If your target account starts to misbehave, you would call a board meeting and try to fix it. The primary attribute of a target account is that it must be measurable and reportable.
You have done bonds and fixed income portfolio management? One of the elements which we use is Duration which is also the interest rate sensitivity, or the amount by which bond prices would change if the rates go up or come down. This duration is measurable and reportable. We have used volatility and value at risk, both of which are also measurable and reportable. Thus, this element which you are using must be sensitive and relevant.
For instance, if you are exposed to interest rate risk, this target account must react to interest rate risk. If you are exposed to fuel risk, this target account must react to fuel risk. Finally, a number of times, you need to explain these target accounts to members of the senior management team and even to your board members.
The target accounts, therefore, cannot be a complex and complicated explanation. For instance, I cannot show the Black Scholes equation to my board members; it will be a disaster. But what I can show them is the thinking behind probability shortfall. Not tell them how I arrived at the thinking, but simply explain the concept, the results, the analysis, implication and the recommendation.
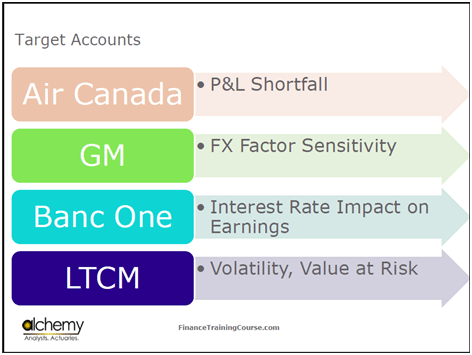
The target account in the Air Canada case was P&L Shortfall, in the GM case was Factor Sensitivity, in the Banc One case is Interest Rate Impact on Earnings, and in LTCM’s case are volatility and Value at Risk.
Linking Risk Exposures, Risk and Target Accounts
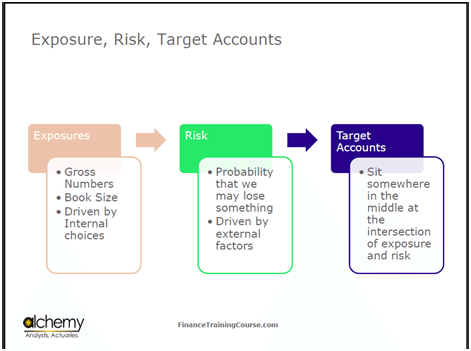
How do you bring together Exposure, Risk and Target Accounts? Exposures are always gross numbers. Suppose that I will consume $733 million worth of fuel oil, and my exposure to the Canadian Dollar is $2 billion. Now, what is risk? The probability that we will lose something, at it is driven by external factors that we cannot control. In Air Canada’s case, there were quadrants in the risk scenario. Three were under control, but one was not, and that is the one that we are focusing on. Finally, what is a target account? It sits somewhere between exposure and risk and allows you to measure the interaction between both of them. Using the Process and Control function, along with the limits that you put into place, it allows you to react before it’s too late.
One of the most common questions that you hear, especially from people who are new to risk management and do not want to spend a lot of money on it, is that if you do all of this process, will it ensure that you will never have a problem and you will never lose money? It doesn’t ensure this; risk management is not about the elimination of risk. When you trip and fall, the process that you have is such that you fall gracefully and are able to recover from it. But if you have no process in place, then there is a very good chance that you will damage something.
One of the concepts that you will need for Banc One is the concept of duration, also known as interest rate sensitivity.
Understanding Duration and Convexity
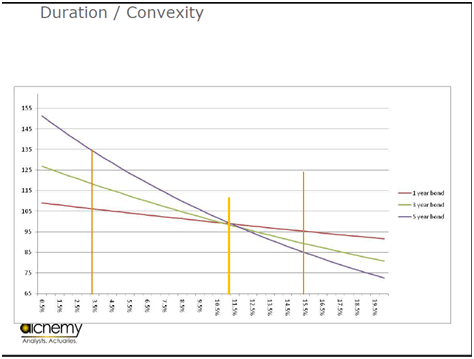
Let us look at this graph. You have three lines here. This is the one year bond. You are interested in the change in the price of the bond as interest rates go up or come down. At its peak, if interest rates are at about 20%, this is worth about $97. When the interest rates are at the bottom at about half a percent, the bond is worth around $107. So the total change across the range is about +-$10. Then, you have a line for the three year bond. In this, the change is a little bit more. The range is from $85 to $125, about +-$40. Then you have a 5 year bond which is about $75 to $150, a range of about +-$75. Thus, you have three ranges: +-$75, +-$40 and +-$10.
Duration is an approximation that allows you to estimate by how much does your bond portfolio increase or reduces in value due to changes in interest rates. As you can clearly see, convexity is another approximation that corrects the error. For example, in this case, if I think about duration, how would I estimate it? It is the rate of change, for which you need the slope of the curve. You, therefore, need to draw a tangent. To estimate the duration for a three year bond, I would draw a tangent at a specific point. The problem with this tangent is that as I move away from the point, there will be an error between what it is really worth and the duration that is predicted. This error is the convexity adjustment.
The problem is that as you increase the duration or the maturity of the bond, longer tenure bonds are more convex.
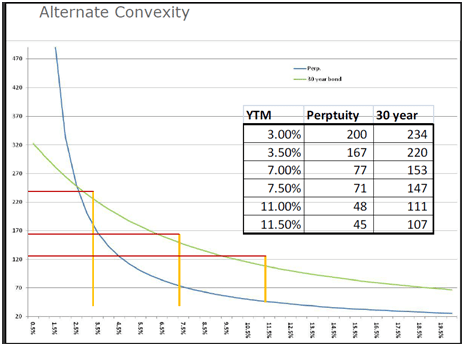
The two extreme examples which I will now look at is the 30 year bond, and the other is what we call perpetuity. Perpetuity is a bond that has no maturity date and pays interest forever. Let’s look at the changes in the bond prices as interest rates change. If you go from 7% to 3.5%, the value of the perpetuity goes from $77 to $167, and your 30 year bond goes from $153 to $220. Now, if you go from 7% to 11%, the perpetuity goes from $77 to $48, and the 30 year bond goes from $153 to $111.
The second attribute of convexity is that convexity is not just a correction term. It is that propensity of an asset that allows it to fall by less when rates are going up, and rise by more when rates are coming down.
Introducing Asset Liability Management (ALM). A quick look at exposure, risk and target accounts.
That was a quick introduction to duration and convexity. Now let’s move on to Asset Liability Management(ALM).
Now that you understand duration and convexity, let’s look at a very basic example. Let’s say that I have a bank. It has assets, liabilities, and assets less liabilities gives you equity.
I have $100 in assets and $90 in liability which leaves me with $10 in equity. This asset is invested in a 10 year zero coupon bond. The liability is a 1 year deposit.
Interest rates are at 10% on the 10 year bond and are 6% on the 1 year deposit. The bank has a spread of about 4%.
Now, let’s assume that interest rates go up by 1% and are now at 11%. The interest rate sensitivity of a zero coupon bond is about 10% which means that as interest rates go up by 1%, prices go down by 10% and you come down to $90. For the 1 year deposit, the interest rate sensitivity is only 1%. This deposit is now worth $89.1. Your equity is now approximately $1. If rates go up, the liability changes in value, and the impact gets taken care of by the sign.
Pick up the balance of any bank in the world. Where do banks mostly invest their money in? Loans, right? What is the typical duration of a loan? Sometimes, a bank buys a bond, sometimes they lend money. Let’s say that I am a small business. I go to a bank and ask them to give me a running finance line. A running finance line is your overdraft line. The bank allocates me a specific amount, and tells me that as long as I use this money and also pay it back, I can use it for a year. From a tenure point of view, you would think that a running finance line would have a maturity of a year. If you have a balance on your credit card account, it makes no sense because the bank charges you an interest of 36%, but the reason why you can’t pay it down is because you have other obligations. So the same case happens with a business. A business draws money over an overdraft line and it utilizes it by buying assets. It is normally not possible for the business to sell those assets and simply return the money to the bank unless the business has positive cashflow. So even though when you say that a bank has invested or lent money, a running finance line is the shortest loan that a bank will give you, but the bank will renew that loan.
Typically, assets of a bank have longer tenures and maturities. Liabilities of a bank have shorter durations, anywhere between 3 months to one year. Even if I have a 5 year deposit, if the bank comes and tells me to give them their money back, then what do I do? All I can tell them is that I won’t pay you, do whatever you can. Assume that everything flows properly. Let’s say that I have bought a car for $100,000. I put $10,000 in it, and the bank puts in $90,000. I use the car for a year and now the car is worth $70,000. The bank now comes to me and tells me to pay them back their loan, which has now $85,000 on it. Even if the bank takes the car, they will only get $70,000 back, while they had put in $90,000 into it. Even if the bank takes the asset from you, it cannot immediately convert it into cash. But when I go to the ATM as a depositor, effectively when I put my card in, what do I tell the bank? I tell them to give my money back. Can the bank now say no to this?
So there are two problems. The first problem is what we call the interest rate risk or the interest rate mismatch. Assets minus liabilities equals equity. Assets of $100 invested in 10 years, and $90 funded from one year ,and an equity of $10. If rates go up by 1%, bank is gone. If the rates go up by 2%, it’s not just that the bank is gone, but depositors also take a hit. That is what effectively happened in 2008. The essence was that the liabilities were more than your assets and the banks had to take money from the government.
The second problem is that even if there is no interest rate mismatch and the interest rates are behaving like you want them to, you have a 10 year investment followed by a 1 year deposit. When this one year depositor asks for his money, you have to give him his money back. To pay this money, you either need to find other depositors or other sources of funding so that you don’t have to sell your assets. When we calculated earlier that the deposit had fallen to $89.1, we did something known as a mark-to-market. In the real world, deposits are not marked to the market, only assets are. This then means that if we were to take the same example again, you would have assets of $90 and deposits of $90. This would leave you with equity of zero, at which point the regulator would shut down.
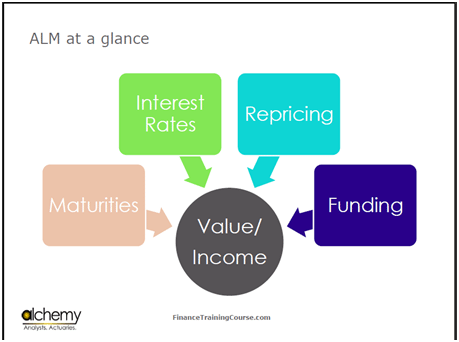
So the ALM function is used to manage these two risks and exposures. If you break this down, you are saying that there are two problems. The first problem is with interest rates. As they change, the value of your assets and liabilities changes. The second problem is with funding. People come and ask for their money back.
The ALM functions focuses on the interaction of 4 pieces. The first piece is Maturities. It needs to be ensured that there is a balance between the maturities both on the asset as well as the liability side. The second piece is the interest rate mismatches. Let’s look at the previous example. When we did this for one year, our depositors gave us a rate of 6%. We took this 6%, and invested it in a 10 year fixed rate bond that earned 10%. A year later, this is still earning 10%, because it is a fixed rate bond. But if this deposit has now been priced at 8%, what happens to the spread now? It goes from 4% to 2%. In the third year, this one year deposit is now priced at 9%, and then at 11%. Now, you have an asset that is earning you 10% being funded by a deposit that is costing you 11%. You are not making money now. Therefore, the third piece that the ALM function looks at is the Repricing piece. The last and the final piece is the funding piece.
Think about the treasury function of a bank. It says that from a banking point of view, if I have x amount of deposits, I need to have Y amount of liquidity, the amount of money that I am going to need day in and day out. But the central bank does not rely on the regulatory function. It wants a bank to do a few things. It wants to make sure that the bank is capable of taking a deposit and has the right people, systems, processes and control. All of this falls under banking regulations.
For every $100 in deposits, I have two requirements. One is the LRR requirement, which is the liquidity reserve requirement. The other is the minimum cash reserve requirement, which is also known as the CRR requirement. A CRR is cash, a non earning asset. I have physical cash either with me or with the central bank. A liquidity reserve requirement is a liquid instrument but is invested in liquid invest bearing securities. The idea is that when customers come to me I can use LRR. If LRR is not enough, then I can use the CRR. In most emerging markets, the combination of CRR and LRR is between 10-25%.
The ALM function does a few things. One is that it is responsible for making sure that the asset minus liability equals equity equation never gets close to zero. The Central Bank takes it one step further and says that this number needs to be at some minimum capital level or must have some minimum Capital Adequacy Ratio. The third function that the ALM committee observes is to ensure that these 4 pieces work reasonably well together.
Please see the Financial Risk Management Training Course page for background, related transcripts, resources and downloads. This is the transcript of one of the sessions at the MBA FRM Course run at SP Jain by Jawwad Farid in June 2012.
Comments are closed.