Sales & Trading Interview Guide: Understanding Greeks. Option Delta and Gamma.
Here is a short and sweet extract from the Sales & Trading Interview Guide series on Understanding Greeks (iBook and plain vanilla PDF version in the works). Rather than focus on formula and derivations, we have tried to focus on behavior. Our hope is the pretty pictures and colored graphs would help take some of the pain away from comprehending this topic.
Delta, Gamma, Vega, Theta & Rho. The five Greeks
There are five primary factor sensitivities that we are interested in when it comes to option pricing and derivative securities.
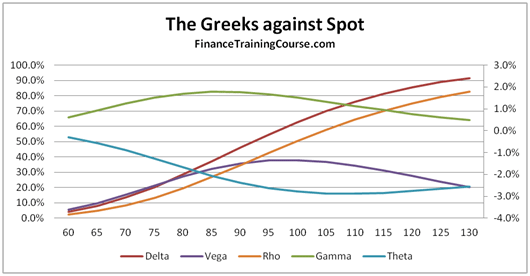
Figure 1 The Five Greeks. Plotted against changing spots
The image above presents a plot of the five factors for an At The Money (ATM) European call option.
Delta (Spot Price)- Measures the change in the value of the option price, based on a change in price of the underlying. Delta is the dark red line in the image above.
Vega (Volatility) – Measures the change in the value of the option price, based on a change in volatility of the underlying. Vega is the dark indigo line in the image above.
Rho (Interest Rates) – Measures the change in the value of the option price based on a change in interest rates.
Theta (Time to expiry) – Measures the change in the value of the option price based on a change in the time to expiry or maturity.
The first four sensitivities measure a change in the value of the option price based on a change in one of the determinants of option prices – spot price, volatility, interest rates and time to maturity. The fifth and final sensitivity is a little different. It doesn’t measure a change in option price, but measures a change in one of the sensitivities, based on a change in the price of the underlying.
Gamma – Measures a chance in the value of Delta, based on a change in the price of the underlying. If you are familiar with fixed income analytics, think of Gamma as Delta’s convexity.
As promised above, we won’t hit you with any equations. However a quick notation summary is still required to appreciate the shape of the curves you are about to see.
Delta, Vega, Theta and Rho are all first order changes, while Gamma is second order change. If you take a quick look at the plot of the five factors presented above, you will see that the shape of the curves are similar for Delta and Rho (the slanting S) and similar for Gamma, Vega and Theta (the hill or inverted U). We will revisit the shape debate later on in our discussion.
Sales and Trading Interview Guide: Let’s talk about Delta
Delta has a handful of interpretations. Some common, some exotic.
The common interpretation is the one we have just covered above. Delta tracks option price sensitivity to changes in the price of the underlying. The second interpretation is as a conditional probability of terminal value (St) being greater than the Strike (X) given that St > X for a call option.
The third and the most relevant definition to our discussion comes from the option replicating and hedging portfolio example from the Black Scholes world.
Figure 3 Delta Hedging. Replicating portfolio for call option using option Delta
As a seller of a call option if you would like to hedge your exposure (short call option) so that when (or if) the call option is actually exercised your loss is ideally completely offset by the change in value of your replicating portfolio.
This replicating portfolio is defined as a combination of two positions. A long position in the underlying given by Delta x S, less a borrowed amount.
Figure 4 – The Delta Hedge Relationship
For a European call option Delta is defined as
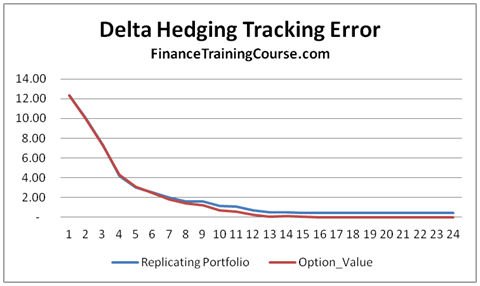
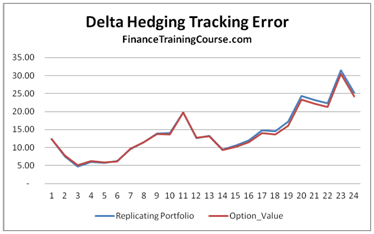
If we adjust Delta and with it the borrowing amount at suitably discrete time intervals we will find that our replicating portfolio will actually shadow or match the value of the option position. When the option is finally exercised (or not exercised) the two positions will offset each other.
Figure 5 Delta Hedging. Replicating portfolio performance for hedging a short call option exposure
The two replications snap shots shown above show how closely the two portfolios move with changes in the underlying price over a one year time interval with fortnightly rebalancing (24 time steps). The tracking error will reduce if the rebalancing frequency is increased but it will also increase the cost of running the replicating portfolio.
Now that we have gotten the basic introduction out of the way, let’s spend some time on dissecting Delta by evaluating how this measure of option price sensitivity changes as you change:
a) Spot,
b) Strike,
c) Time to expiry and
d) Volatility.
Where relevant and important, we will add more context by also looking at how Delta’s behavior changes if the option is in, at, near or out of money.
Sales and Trading Interview Guide: Dissecting Delta – Against Spot
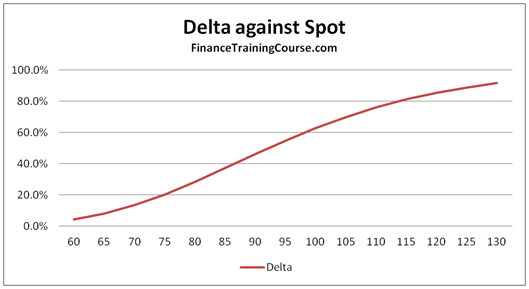
So how does Delta behave across a range of spot prices.
If we assume that we have purchased or sold a call option on a non-dividend paying stock with a strike price of US$100. The underlying is currently trading at a spot price of US$100. The time to expiry or maturity is one year.
Figure 6 Delta plotted against changing spot prices
The graph above shows the change in the value of Delta as spot prices move higher or lower from the original US$100.
In this specific instance while we have moved spot prices we have held maturity constant. As a result while spot prices for the underlying change from 60 to 130, the option’s delta doesn’t touch zero or 1, since there is a chance that it may still switch direction and go the other way.
How does the behavior of Delta change if you move across At money options to options that are deep out of money or deep in the money? Think about this for a second before you move forward. Would you expect to see a different curve? Or a different shape? How different?
Let’s start with at, in and near money options.
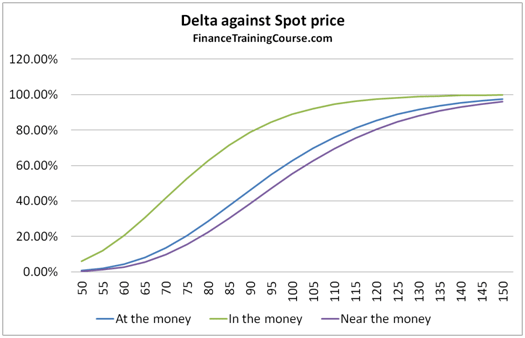
For at money or near money options the shape remains the same. For options that are deep in the money, it becomes asymptotic before finally touching 1. From our hedging definition above, this means that the seller of the option should now own the exact numbers of shares of the underlying committed to the call option (Delta = 1) since the option will most certainly expire in the money. From a probability definition perspective, for a call option a conditional probability of 1 indicates that the option is certain to expire in the money.
Figure 7 Delta against Spot. At, In and near money options
But what about deep out of money options? What happens to Delta or for that matter to all the other Greeks discussed earlier when it comes to deep out of money options.
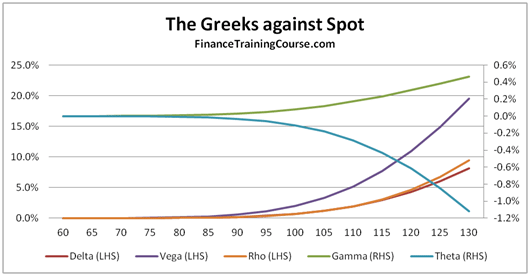
We answer this question by plotting the Greeks for a European call option written with strike price of US$200, while the current spot price is only at US$100. In the price ranging between US$60 and US$130, the value of Delta touches zero and then slowly rises to about 8% as the underlying spot price reaches US$130.
The overall shape remains the same, all we are doing now is just looking at a different pane of the option sensitivity window. Slide a little further or put the two images (figure 7 and figure 8) side by side and you should be able to see the complete picture.
Figure 8 The Greeks against Spot. Deep out of money options

Figure 9 The Greeks against spot. AT, In and near money options
The next natural question deals with the valid range of values that Delta is expected to take. For a call option the range is between 0 and 1, as we have seen demonstrated above. Zero for deep out of money options, one for deep in money options. In between for all other shades.
For put options, Delta ranges between 0 and -1. Deep in money put options touch a Delta of -1, deep out of money put options reach a Delta of zero. The negative sign corresponds to a short position. To hedge a put, unlike a call, we short the underlying and invest the proceeds, rather than buy the underlying by borrowing the difference.
Sales and Trading Interview Guide: Dissecting Delta & Gamma – Against Strike
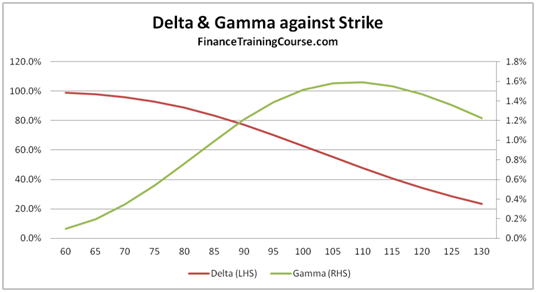
Figure 10 Delta & Gamma against changing strike price.
The next graph plots Delta and Gamma against changing strike price. We use a plot of both Delta and Gamma to reinforce the relationship between the two variables. Once again before you proceed further think about why do you see the two curves behave the way they do?
As the strike price moves to the right, the option gets deeper and deeper out of money. As it gets deeper in the deep out territory, the probability of its exercise and the amount required to hedge the exposure fall. Hence the steady decline in Delta as the strike price moves beyond the current spot price.
As the rate of change of Delta increases, we see Gamma rise by a proportionate amount. Gamma will only flatten out once the rate of change of Delta flattens out in the image above.
Sales and Trading Interview Guide: Dissecting Delta & Gamma – Against Time
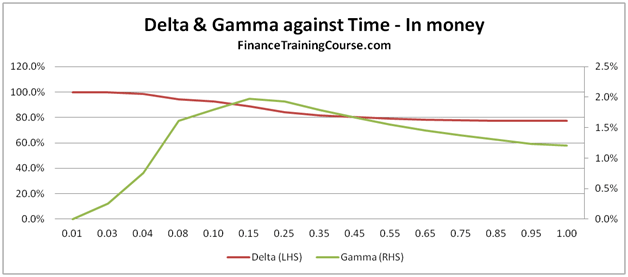
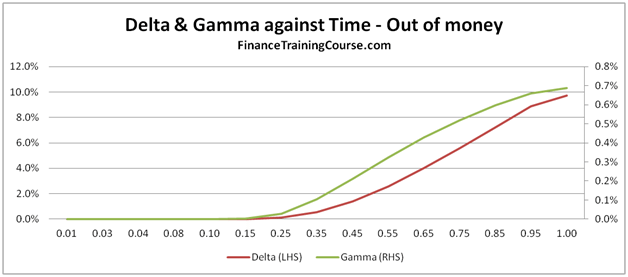
The next three plots show how Delta and Gamma change as we vary time to expiry from a day to one year.
In the three snapshots that follow below, time moves from right to left (more to less). Once again we use both Delta and Gamma to reinforce the relationship between the two factors.
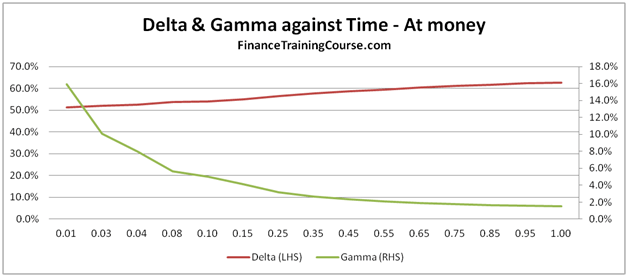
The only other variation from the options above is that we are now looking at three different options. An at money Call (Spot = 100, Strike = 100), an in money call (Spot = 110, Strike = 100) and a deep out of money call (Spot = 100, Strike = 200).
Notice how delta declines with time for an at money call, but rises to 1 for an in money call. Beyond a certain cut off point, it also rises for a deep out of money call but not as much as our first two pairs.
Figure 11 Delta & Gamm against Time for in, at and out of money options
Sales and Trading Interview Guide: Dissecting Delta & Gamma – Against Volatility
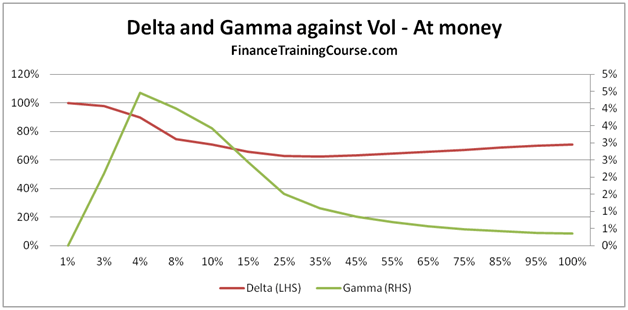
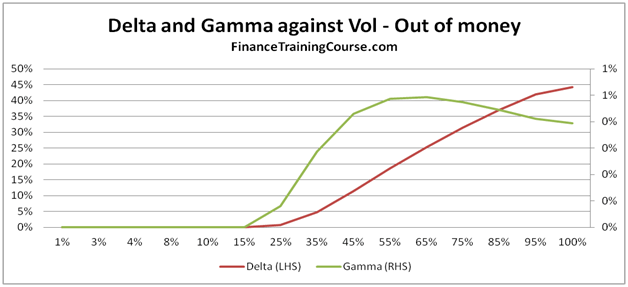
Figure 12 Delta, Gamma against Volatility. For at and out of money options.
For our last act, we plot Delta and Gamma against volatility and see a result which some students find counter intuitive.
For in, near or at money option, Delta actually falls with rising volatility. For most students this is a surprising result. Once would expect that with rising volatility, the value of the option should go up (correct) because the range of values reachable by the underlying is higher (also correct) hence leading to a higher probability of exercise (incorrect).
For deep out of money options, Delta rises with rising volatility. Gamma keeps pace initially but then runs out of steam as the rate of increase in Delta begins to flatten out.
To appreciate this behavior you actually have to move away from the Greeks and look at exercise probabilities.
Understanding the relationship between volatility, probability of exercise and price.
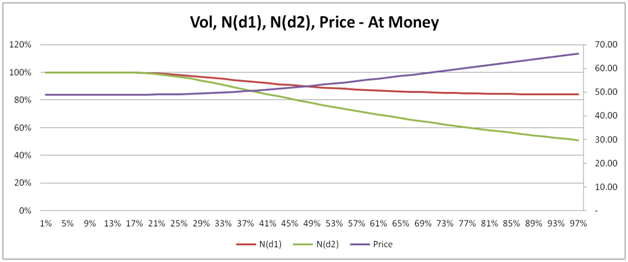
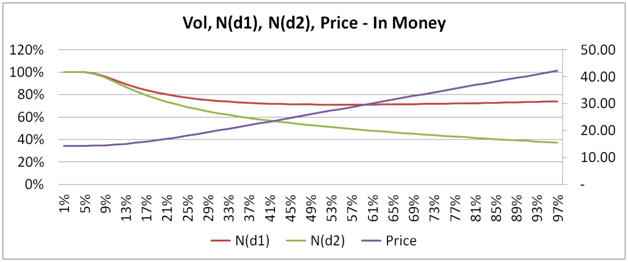
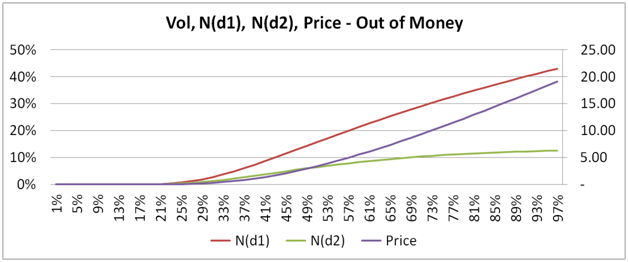
Our next three plots, show how the conditional probability of exercise N(d1), the unconditional probability of St > X, N(d1) and price behave and change for in, at and out of money European call options.
In the images beneath, Price is measured using the right hand scale, while the two probabilities are measured using the left hand scale.
For at, in and near money options, the two probabilities actually decline as volatility rise. Sounds counter intuitive when you consider that while the two probabilities are declining, the price of the option is actually rising.
Here is a hint, look up and think about volatility drag. For a deep out of money option the trend is reversed. Once again ask yourself why?
Figure 13 Vol, N(d1), N(d2) and Price for in, at, and deep out of money call options
Understanding Greeks: Option Delta and Gamma Review. Conclusion
If you are interested in a career on the floor or on a derivatives trading desk, you need to get very comfortable with the above graphs and behavior of Greeks across them. To the point of the lessons discussed becoming second nature – like riding a bike, breathing or drinking coffee. To remove the shock and awe caused by the partial differential equations behind the Greeks, we completely eliminated them from this post. In real life and when modeling them in excel you will have to get re-acquainted. Drop us a line with your questions or other dimensions that you would like us to address and if we can, we will do a few more posts on this topic.


Comments are closed.