Understanding Option Greeks – Introducing Gamma
Gamma is the second derivative of the option price with respect to the price of an underlying asset. Alternatively, it is the rate of change in the option Delta due to a change in the underlying asset price.
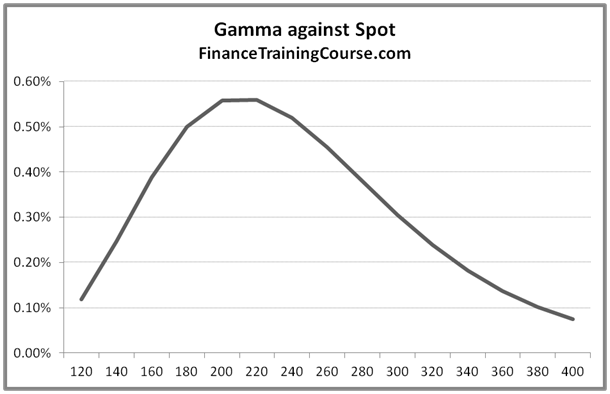
Figure 1: Gamma against Spot
What does that mean in simpler language?
In the image above the Gamma peak corresponds to at money options while the dips at the two ends correspond to deep out and deep in money options. Given that Gamma is the rate of change that implies while you may have a deceptively small Delta for an option position, Gamma is the indication of how much that Delta would change on account of a small change in price. For an interesting illustration see Traderbrains treatment of the same material.
If you hedge your Delta but ignore your Gamma your hedge may remain effective as long as prices don’t move but a large movement in the underlying will move Delta as well as your underlying exposure. For at the money options the risk of large moves impacting Delta is higher (higher Gamma), for deep in and deep out of money options, the risk of large moves impacting Delta is lower.
We examine the relationship between Delta and Gamma, between Gamma and money-ness and between Gamma and time to expiry in a series of images below:
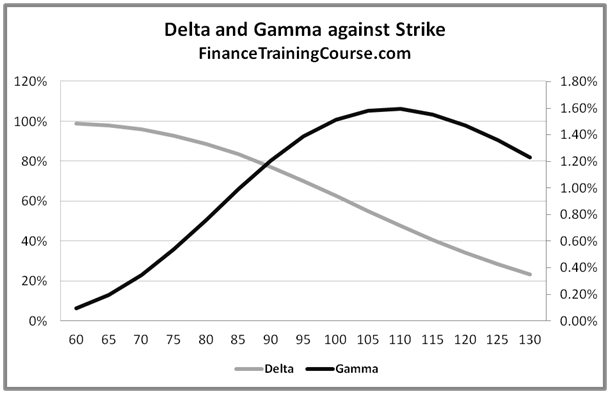
Figure 2 Delta and Gamma against strike
The above graph plots Delta and Gamma against changing strike price. We use a plot of both Delta and Gamma to reinforce the relationship between the two variables. Once again before you proceed further think about why do you see the two curves behave the way they do?
The answer lies in the relationship between Delta and Gamma. Gamma is the rate of change in Delta with respect to change in the price of the underlying. As the rate of change in Delta rises, Gamma will rise, as it declines Gamma will also decline.
In the figure above, as the strike price moves to the right from left, the option gets deeper and deeper out of money. As it gets deeper in the deep out territory, the probability of its exercise and the amount required to hedge the exposure falls. With it the rate of change in Delta also slows down hence the steady decline in Delta as the strike price moves beyond the current spot price.
As the option moves from being deep out of money to near or at money, we see the rate of change of Delta increases and with it we see Gamma rise. Gamma flattens out once the rate of change of Delta flattens out.
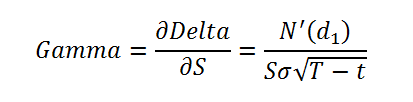
Gamma may be calculated using the Black Scholes formula and formal definition would be:
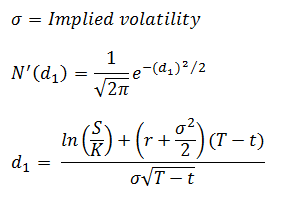
Where
S = Stock Spot Price
r = Risk free rate
T = Time to Maturity in years
t = Current Time
The denominator in the equation suggests an interesting relationship between Gamma, time to expiry and volatility. The time to expiry relationship is examined in the two graphs below for deep out of money options as well as at and near money options. Can you see the relationship?
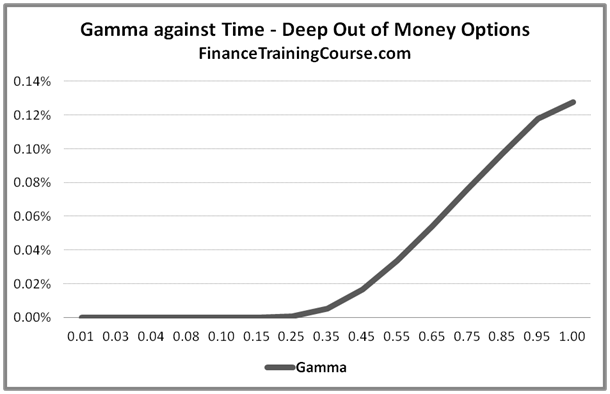
Figure 3: Gamma against Time for deep out of money options
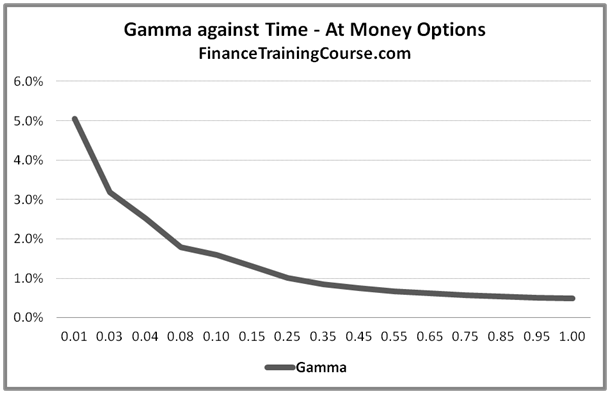
Figure 4: Gamma against Time for at the money options
In the figures above, time moves from right to left (from more to less). Gamma has a different reaction to changing time to expiry depending on the money-ness of the option in question.
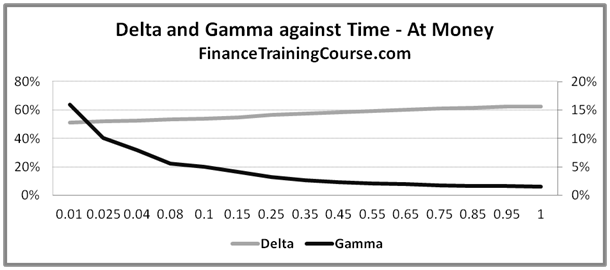
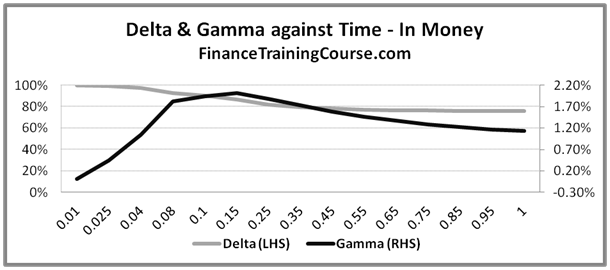
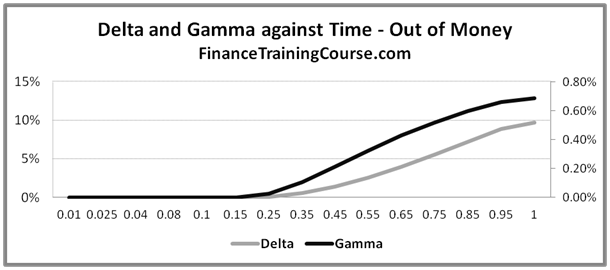
Figure 5: Delta & Gamma against Time for in, at and out of money options
We now use Delta and Gamma plots to reinforce the relationship between the two.
The three panels above are used to dissect an at money call (Spot = 100, Strike = 100), an in money call (Spot = 110, Strike = 100) and a deep out of money call (Spot = 100, Strike = 200).
Notice how Delta declines as time to expiry for an at money call, but rises to 1 for an in money call. For a deep out of money call on the other hand it rises as time to expiry increases, though the level reached is not as high as that reached by the first two options.
For deep out of money options Gamma declines as time to maturity is reduced. For at or near money options Gamma increases as the option gets closer to expiry.
Rather than assuming symmetry it is useful to calculate up Gamma and down Gamma. They represent change in Gamma when prices move up and down respectively.
The graphical difference between the up Gamma and down Gamma changes is depicted below:
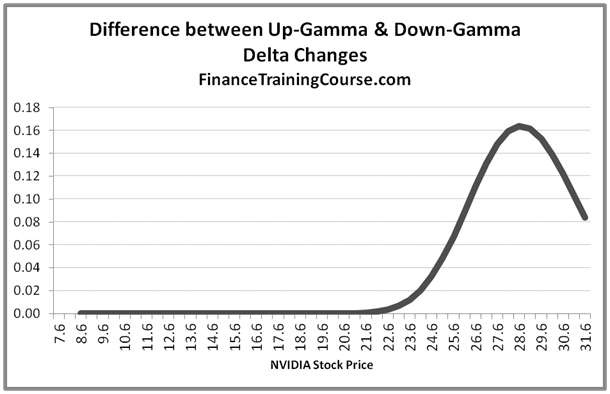
Figure 6: Difference between Up Gammas & Down Gammas for deep out of money options on NVIDIA stock
We can see that the difference does not remain constant as asset price changes. Hedging exactly for Gamma fails to account for the fact that changes in Delta are not constant across asset price changes. Up-Gamma for a call option is always greater than Down-Gamma. Do you think the same relationship holds true for put options or will that be different? Why do you go ahead and repeat the above exercise for a put option, plot the graph and see what happens.

Figure 7: Delta & Gamma against changing strike price