Our alternate model for calculating Economic Capital comes in multiple variations. We do a detailed presentation for Method One, followed by smaller posts on each variation. Method One uses changes in shareholders’ equity as reported in publicly disclosed financial statements to build the model for calculating economic capital.
Method One
Step 1 – Calculate the return series for change in shareholders’ equity
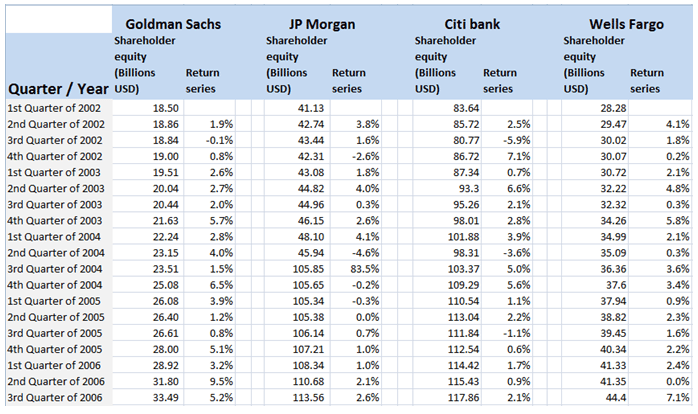
Once we have collated the data from our data source, the first step is to calculate the return series for the five banks from 2002 to 2014.
We are measuring the rate of change in shareholders’ equity from one quarter to the next quarter. Here are the results for the 5 banks based on the dataset from 2002 to 2014. Barclays’ data as discussed is on a semiannual basis. All other banks are on a quarterly basis.
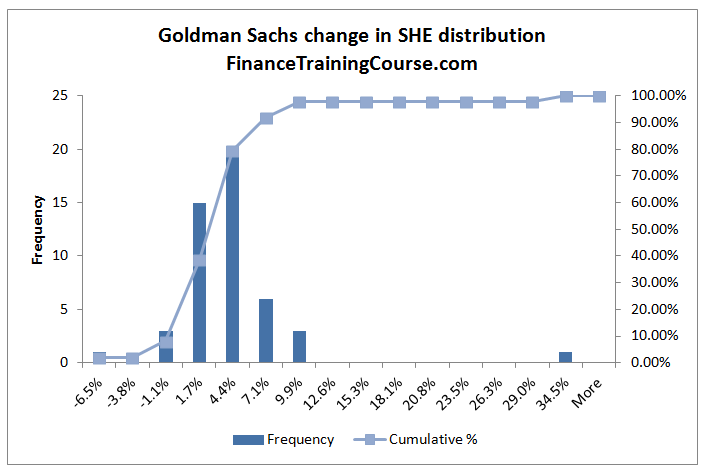
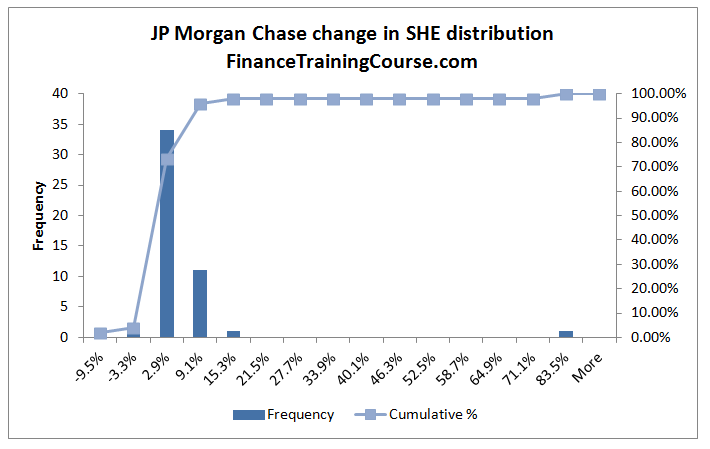
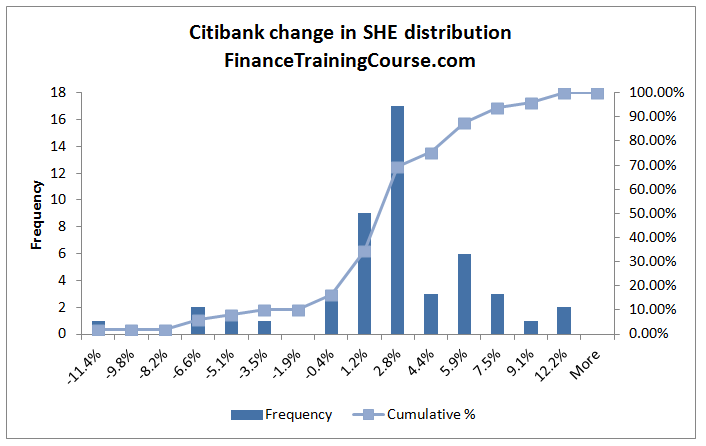
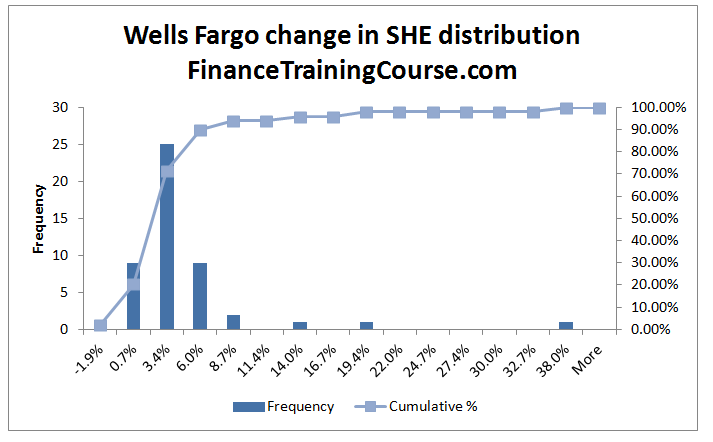
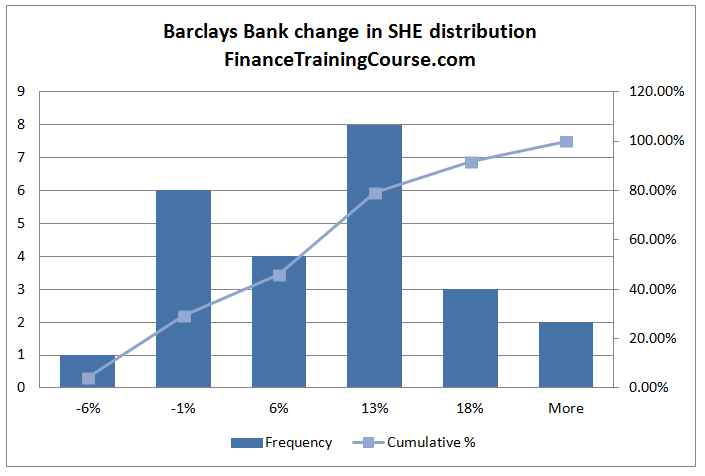
Step 2 – Plot the distribution for changes in Shareholders’ Equity
Citibank and Barclays stand out in terms of the breadth of their distribution. Compared to Goldman, Wells and JP Morgan the distance between the worst case change and the best case change is the lowest in the case of Citibank as well as Barclays.
In comparison to Goldman, Wells and JP Morgan, the probability of a negative change is also highest for Citi and Barclays. Interestingly enough, the distribution of Barclays centers around the highest median change of 13%. The other four are all lower than 13%.
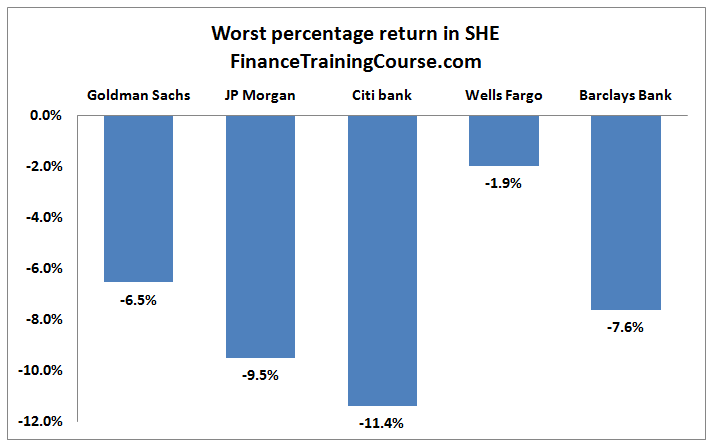
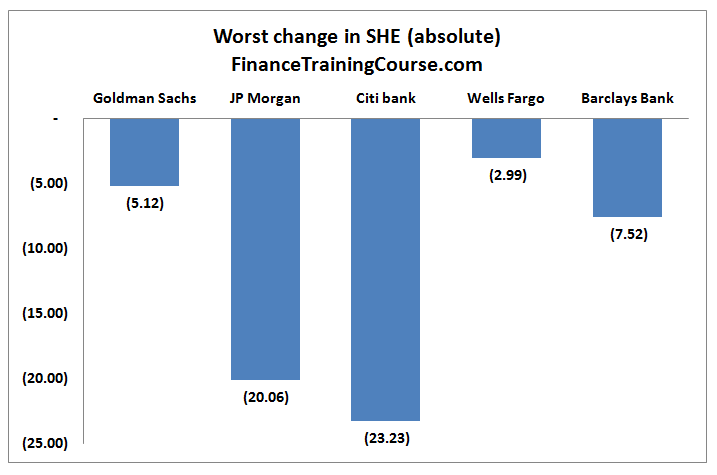
Step 3 – Find the worst return (percentage terms) and worst loss in absolute terms
The changes in the shareholders’ equity histogram series above gives the worst case change (in percentage terms) for each bank. We apply the percentage change on the most recent shareholders’ equity value to estimate the absolute worst case change in dollar terms.
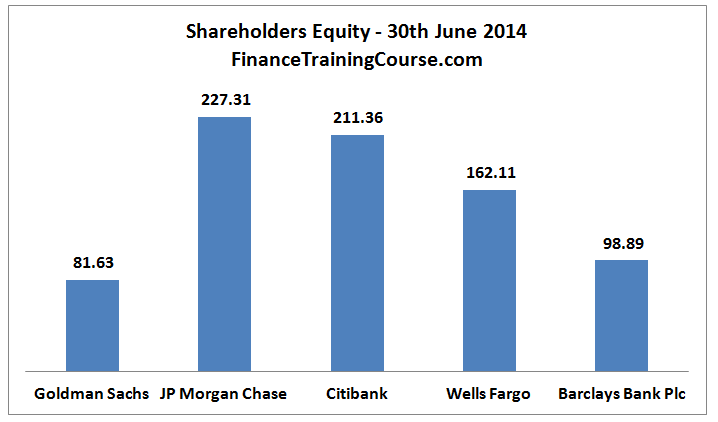
There are two sets of worst case loss figures. The first uses the last full year results of shareholders equity figures (as of 31 December 2013).
The second set of numbers uses the most recent quarter (30th June 2014) figures to estimate the worst case loss.
Step 4 – Determine the intervention thresholds
The best intervention models assume that markets and regulators will act before the full depletion of capital. Ideally, at the first hint of trouble, the threat of market or regulatory intervention should make a bank’s board take corrective actions. Sometimes this implies painful decisions that may be debatable but are still better than a complete loss of control. From a modeling point of view, this means that we do not have the luxury to see our stock of capital evaporate before external counterparties will take notice of our difficulties.
For the purpose of the current exercise, we set the intervention threshold at some minimum capital adequacy requirement. This capital adequacy requirement would be the greater of what the market and the regulator believe a bank should maintain in order to retain the ability to participate as a counterparty within the Interbank market.
For the purpose of our analysis, we have set this threshold at 10%. When a bank fall below the 10% threshold model expectation is that either the regulator or market forces will react.
An unexpected loss, a large regulatory penalty, a crisis of confidence, a run on liquidity, a change in leadership, the loss of a key investor are all triggers that may lead to a change of fortunes and an expected shortfall
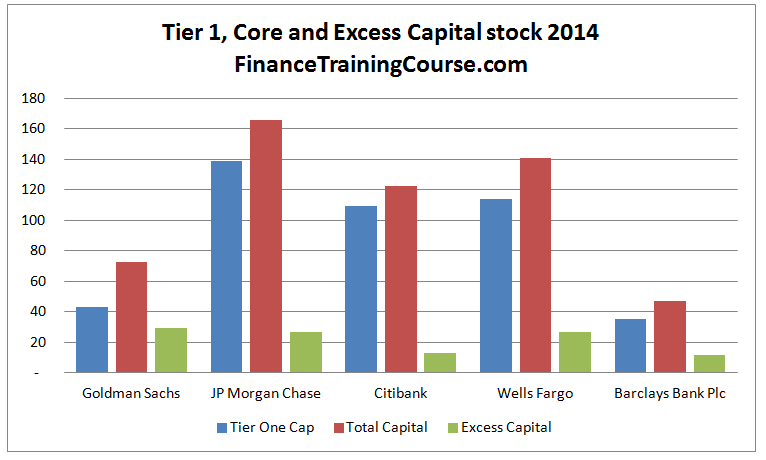
Step 5 – Determine Excess Capital
The stock of excess capital is simply the difference between core capital and regulatory capital requirements.
This is the amount that acts as a buffer for future losses.
The question we want to ask is what is the quantum this buffer can bear and protect against? What is the likelihood that a series of events may ultimately lead to claims higher than the calculated excess capital amount?
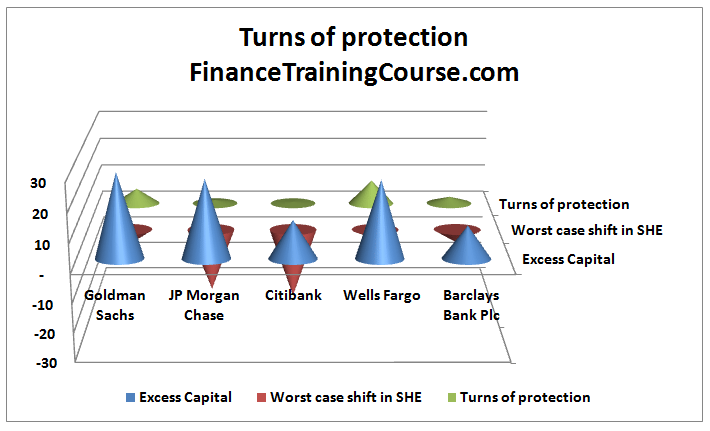
Step 6 – Estimating the loss bearing capacity of excess capital stock
To calculate Turns of protection simply divide Excess capital stock by the worst case change in shareholders’ equity. The odds of a worst case turn are 1/49 or just over 2% for the first four banks. For Barclays, the number is 4% because we only had half the data points.
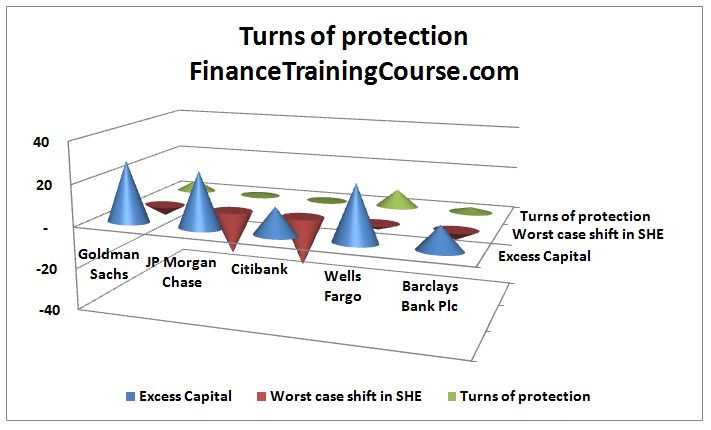
Step 7 – Calculating economic capital estimates
Within the current dataset, the probability of a single turn loss equivalent to the worst case historical loss is just over 2%. This is true for the first four banks because the worst case loss represents 1 loss in 49 data points. For Barclays Bank plc, the worst case loss represents 1 in 24 data points and the probability doubles to 4.08%.
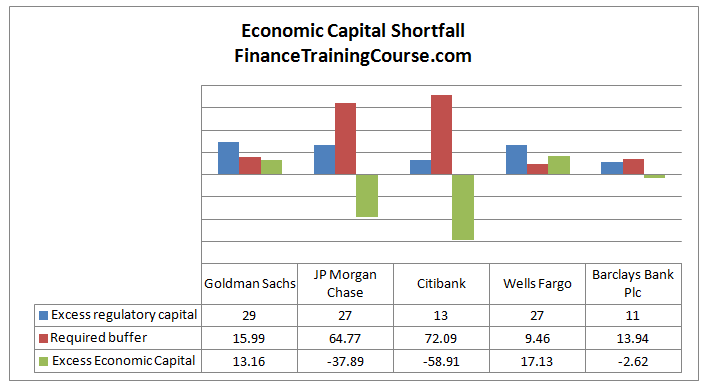
Let’s assume that our board decides that they are only comfortable when the bank in question has sufficient buffer to withstand not one but three such consecutive shocks. If a bank’s reserves of capital can survive three such shocks, then the bank is safe and anything beyond that amount is excess economic capital.
This implies that our estimate for additional economic capital is the difference between regulatory capital and the stock required to survive three shocks.
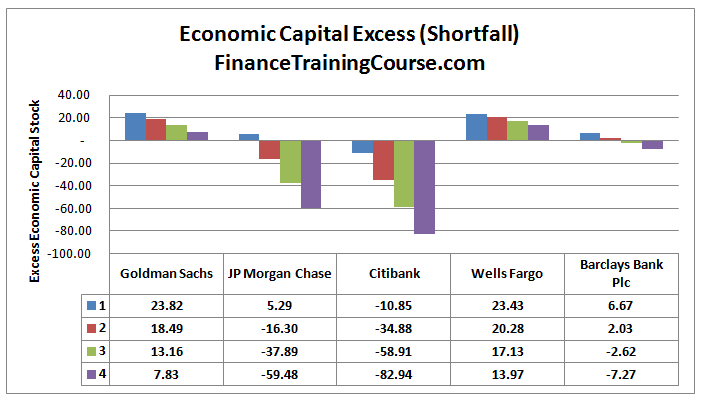
How would these numbers change if we moved the threshold to a single turn or four worst case loss turns? How do your 5 banks fare in terms of their stock of economic capital?
Which one is the most well capitalized? Which one is the worst capitalized off the lot?
Issues with Model One for calculating Economic capital
The primary issue with our Model One for calculating Economic capital is its rigidity in calculating probability intervention. While we have a 2% probability of an intervention for the first four and a 4% for Barclays, what if we need to evaluate capital stock at 10% or 5%
Here is the problem. Our ability to complete this calculation is dependent on the granularity of the underlying distribution. The distribution differs for each bank. We can answer this question for Goldman, JP Morgan, Citibank and Barclays. However, we won’t be able to do the same for Wells Fargo since there are not enough data points for it.
And if we care to calculate the same numbers at a 20% threshold, we won’t be able to do this for any bank other than Barclays.
So it would be useful to explore an alternate method. One that is not limited by how finely cut our change in Shareholders’ equity distribution is.
Other methods for calculating economic capital
In this post, we have looked at calculating economic capital by using worst case shifts in shareholders’ equity. We discuss the other variations for calculating economic capital in the following posts:
Comments are closed.