In our previous post on Valuation Multiples we spoke about the intuition and linkages between multiples, growth, return on equity and cost of equity (read: opportunity cost). For example and context we examined in the recent MSFT LNKD transaction using data from tech sector in the US for the basis of our calculation.
In this post we repeat the process for the banking sector in the Middle East, specifically UAE. This serves as an illustration and a model exam solution for driving intuition for valuation multiples across sectors and geographies. The solution is presented as an annex to this post that you can refer to when you attempt to solve the in class assignment for the Bank Valuation course.
Valuation Multiples Assignment
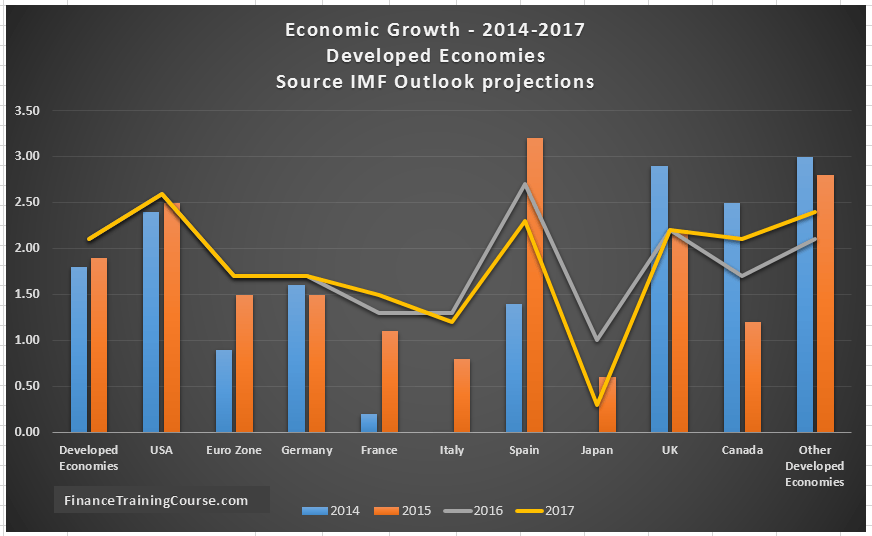
In addition to US and UAE markets, we also share the economic growth forecast for members of G7 countries as well as a broad group titled developed economies of the world. The source of these forecasts is the IMF global economic growth update published in January 2016 (see the reference section below).
Please reproduce the exercise performed for the banking sector in UAE for a specific segment geography combination of your choice. The objective is to get a sense of what is a reasonable and relevant range for valuation multiples for companies in a given sector in your markets. You can do this by generating the grid for Price to book and Price to earning ratios as done in our original post as well as illustrated in the UAE country profile below.
Once you get this range for both Price to Book and Price to Earnings, compare this with where the market is right now in terms of current prices and multiples for your selected sector. There is a reasonable chance that you will see divergence between your calculated relevant range and market values.
How would you reconcile the two? Please back your reconciliation with data and arguments that can be backed up with real data.
Valuation Multiples Intuition – Model solution.
UAE Country and Banking sector profile
The United Arab Emirates (UAE) transformation over the last thirty years is nothing short of remarkable. From sleepy metropolis in the 80’s to fast moving 9 lane highways, exits and intersections in the 21st century. Comprised of 7 emirates, the country is better know for two of its city emirates.
- Abu Dhabi, home of Abu Dhabi Investment Authority (ADIA) and ADIC, two of the world largest sovereign wealth funds, ADNOC, a global oil producer supplier and Etihad airlines.
- Dubai, a dynamic regional center for trade, tourism and finance that now counts 3 million souls as residents and hosts 60 million transit passengers a year through flagship airports and Emirates airlines.
The Abu Dhabi and Dubai development story has many interesting twists and turns. Starting in mid 90’s with a clear cut ambition to build a global financial center on the fringe of the Arabian Peninsula, the epic tale includes growth of Emirates airline and Dubai airports, the collapse of a real estate bubble in 2008, a thriving services, trade and SME sector built over four decades and excess cash flows generated by high oil prices in the 5 years between 2009 and 2015.
The two city estates today boast infrastructure that can easily stand head to head with any first world metropolis including a city wide metro, the tallest building on the planet, a creek side F1 racing track and multiple tourist focused destinations and resorts.
Of the two cities, Abu Dhabi is more understated and oil dependent, while Dubai is cosmopolitan and relatively less dependent on oil. Both emirates have worked hard to widen their economic posture and reduce dependence on oil revenues but significant decline in oil prices in the last eighteen months and the lifting of Iran sanctions has sapped liquidity out of the local market.
The impact on liquidity has been felt across the financial services sector with a slow down in real estate prices and the rise in bank customer skipping within SME and retail customers. A bigger challenge has been a repeat telecast of mistakes made on the investment and treasury front. The lesson learnt in 2008 crisis was to stay away from western markets and avoid large USD exposures. The challenge in 2015 is very different. The flood of liquidity generated during the last five years was unfortunately parked in regional securities at peak rates and prices. With the fall in oil prices and regional markets that portfolio is now sitting largely underwater and in the red.
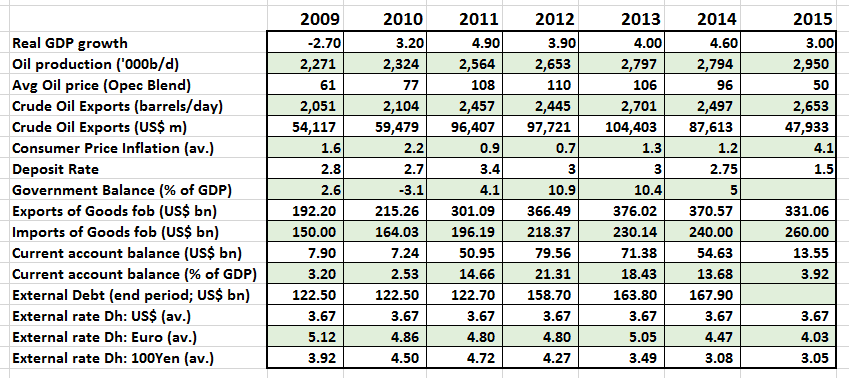
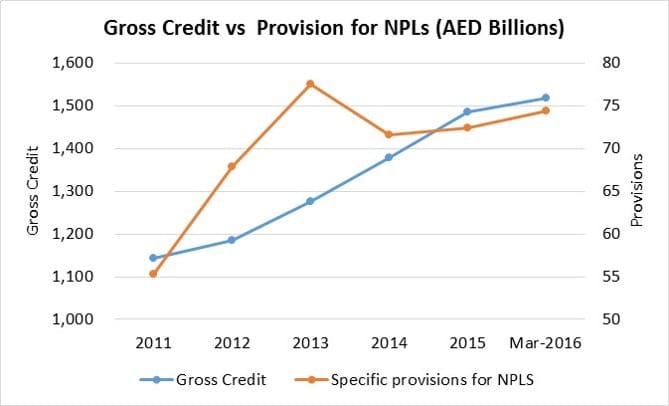
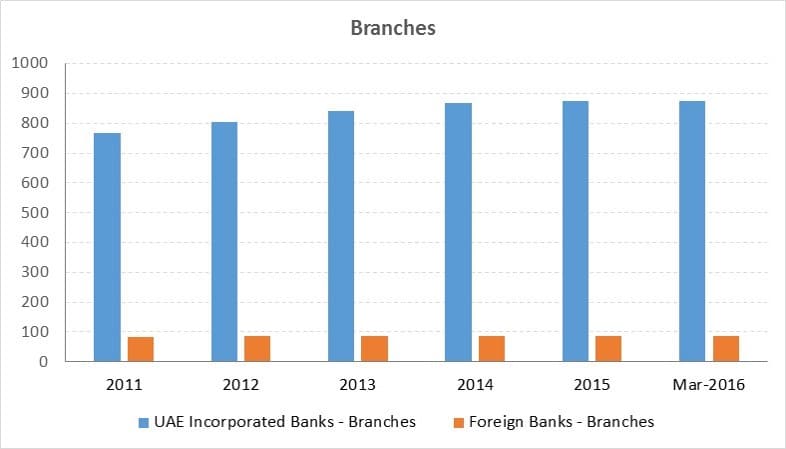
Figure 3. Banking sector – Number of branches – UAE 2011-2016
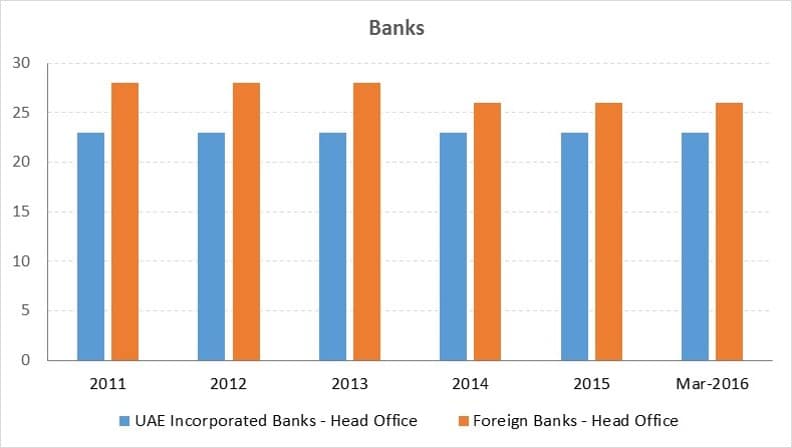
Figure 4. UAE Banking sector – Number of operational banks – 2011 – 2016
Estimating growth, ROE and ROC for UAE Banking sector
As is obvious with some of the statistics shared above, the UAE banking sector is ripe for consolidation. Given the over investment in the sector (800 branches for a country with a population of less than 8 million), the current trend in oil prices, and the slow down in real estate we don’t expect banking to grow at a rate faster than the GDP. We there fore pick a slightly generous 2.5% compared to the more conservative 1.9% projected by the IMF. With a stable AED-USD peg, deposit rates at 1.5%, inflation at 4% our opportunity cost estimate for banking industry is 6%. ROE is estimated at 8%.
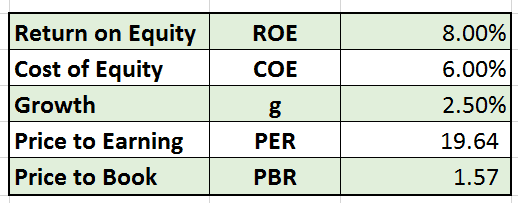
Table 2.0 Estimated growth, ROE and ROC figures
When we put these parameters to work, we generate the two grids for valuation multiples. Price to earning ratio and Price to book ratio. The grid present relevant ranges for combination of terminal growth and ROE values used in the PE and PB ratios. COE is held constant at the original value.
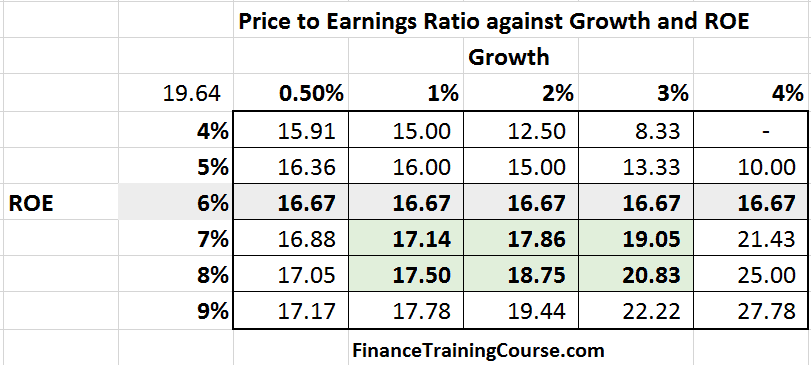
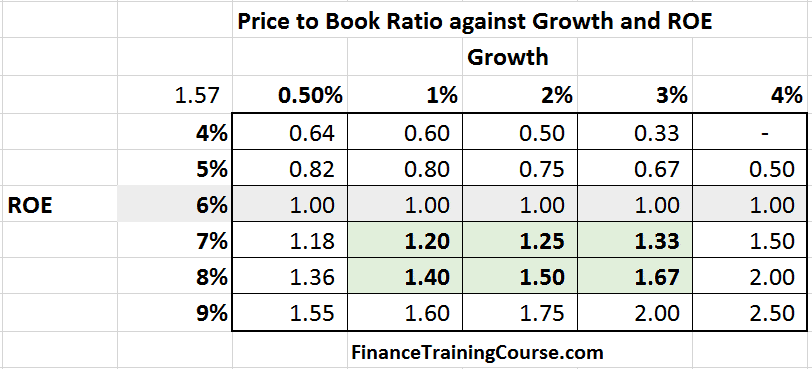
The cells highlighted in light green represent likely and relevant ranges for multiples in the banking sector in UAE for the choice of parameters picked above. If the parameters change, the grid will also change.
Reference
- IMF-Global-Growth-Forecasts-Jan-16
- UAE Country Profile – CB UAE dataset and updates