Valuation models – where do valuation multiples come from?
In the valuation models world, transactions are frequently quoted in terms of valuation multiples. The most commonly used multiples break down transaction price in book value per share or earnings per share.
For instance, review the recent acquisition of Linkedin (LNKD) by Microsoft (MSFT). If you dig within the press releases and analysis you will see references to Price to book and Price to earnings. 5.675 times trailing book (31 March 2016) and 54 time projected forward earnings (31-12-2016).
Translated these statements mean that Microsoft paid 5.675 times the book value per share of $34.54 as at March 2016 to acquire Linkedin. In terms of earnings Microsoft paid 54 times projected year end 2016 earnings of US$480m.
Within technology acquisitions Price to book tends to be irrelevant because of valuation of intellectual property issues and how R&D efforts are expensed, but Price to earning is still a valid benchmark. Both elements give you an indication of how cheap or expensive this transaction is/was when compared to similar acquisitions in recent history.
Even if the primary valuation model is discounted dividends or discounted cash flows, you can’t escape valuation multiples. When we present a transaction for approval to board members, shareholders and analysts, their assessment of the relative appeal of an acquisition is based on the premium we pay over book or earnings. While sophisticated multi-tab models are great while we thrash out how the deal would create value, at the Board or Analyst level, valuation multiples provide a simple tool to do back of the envelope calculations. It also makes it possible to do quick comparisons with peers and other potential targets.
Valuation multiples source and intuition?
A natural question then is where do these valuation multiples come from? Is there a basis that allows us to determine if a Price to book or a Price to earnings ratio is reasonable or likely to be accretive rather than dilutive over the life of a transaction? Is there a mathematical relationship that drives these ratios? Does that relationship extend to the two ratios? Let’s take a look at answering this question.
Dissecting valuation multiples.
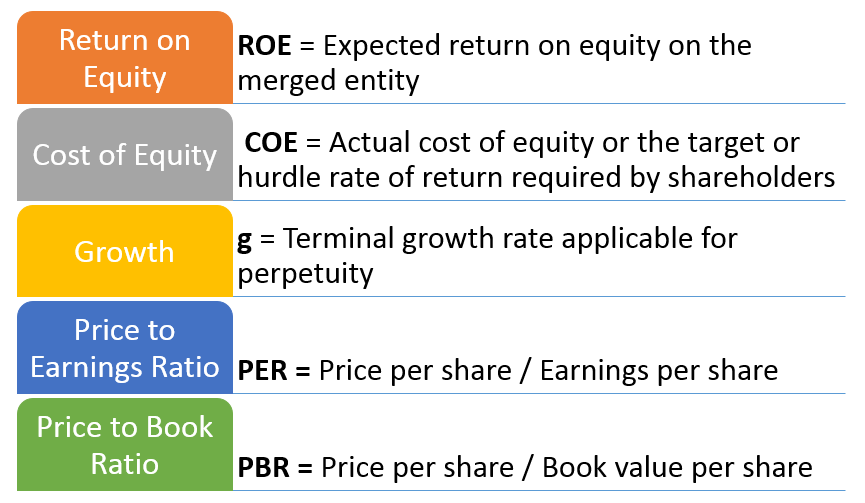
We first need to define some common variables and terms that we will use in our analysis. They are:
Is there a mathematical relationship between the two ratios? The short answer is yes.
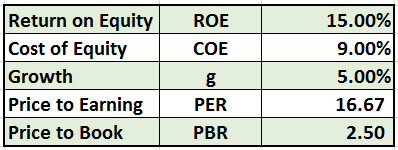
To explore this relationship further let’s begin with some default values for the terms we have just introduced above.
What should be the source for these figures? If MSFT is acquiring LNKD, despite all the press about retaining independence, LNKD will ultimately be sucked into the same growth funnel as MSFT. Alternatively LNKD stakeholders will be rewarded by MSFT performance because on account of size MSFT performance will always overshadow LNKD numbers.
So the numbers we pick are representative of MSFT behavior. Given LNKD’s recent track record, that is being a bit generous but the whole thesis behind the transaction is that MSFT will be able to pull LNKD out of its downward spiral.
Within the current environment as applicable to the publicly traded technology industry space we pick ball park numbers from Morning Star. Looking at the ROE trend for MSFT on Morning Star and picking up the Trailing Twelve Month (TTM) figure we get 12.71% (as at 17th June 2016). In the next line we get the figure for Return on Invested Capital at 8.62%, which we use as a proxy for Cost of Equity. There are challenges with this assumption, but we use it as a crude approximation.
We round up both numbers. ROE to 15%, COE to 9%. For growth, the number we need is terminal or perpetual growth. Again looking at Morning Star the trend is actually quite discouraging for MSFT but as we mentioned earlier, June is the month for feeling generous. Given its exalted status in the technology space, we give MSFT growth a 2.4% premium over projected US economic figure of 2.6% (source IMF, see reference below) for the next two years.
When we plug in these figures into the mathematical relationship for Price to Book and Price to Earnings ratios what do we see?
Price to book
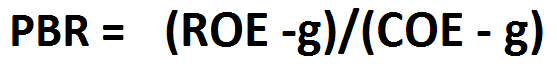
The Price to Book ratio is the accumulated difference between the expected return on equity and the hurdle rate (cost of equity) with both rates adjusted for terminal growth. The higher the differential between ROE and COE, the higher the Price to Book ratio.
In value creation terms think of cost of equity as the opportunity or economic cost of capital. Anything you can earn on top of that for perpetuity, adjusted for growth, is excess return. Hence added value.
If we take our formula for a ride using return on equity on one side and terminal growth on the other end, we generate the grid that follows. There are only two variables here, growth and ROE, everything else is held constant. (See primer on Excel Data Tables).
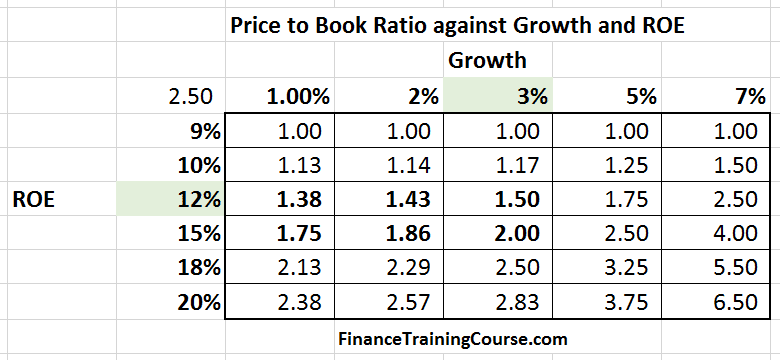
The vertical variable (in bold) in the second column is return on equity (ROE range 9% – 20%). The horizontal list in the third row is the terminal growth rate (g range 1% – 7%). Each cell in the grid represents a value for the Price to book ratio when the applicable return on equity (ROE) and terminal growth (g) assumptions intersect.
For instance, the first row in the grid with 9% ROE has a constant value of 1.0 because COE is held constant at 9%. We therefore end up with the same value in the numerator and the denominator across all values of growth.
Reading the grid.
If you are analyzing future performance of established players in the tech industry such as Microsoft and Linkedin, what would represent reasonable choices of parameters in your mind?
While both players operate globally, one could assume that the largest share of their revenues would come from North America and Western Europe. Within that geographic segment growth cycles range below 3%. In recent history recessionary cycles or zero real growth periods with zero job growth and limited capital investment have been more likely than sustained growth. Similarly on the ROE front for both MSFT and LNKD growing ROE has been a real challenge in recent years. For MSFT the number has been in downward spiral for the last few years, for LNKD its negative.
With this context let’s take a second look at the Price to book grid. This time with a different lens. The key to the color code we use in the revised grid (our new lens) is shared below:
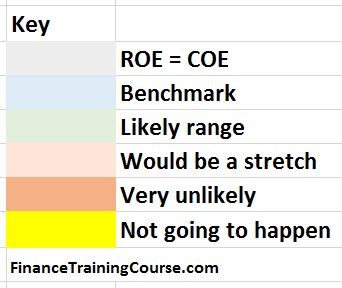
Take a look the likely range of PB values denoted by the light green shade. That value is capped at 2.0 or twice book value for a company reaching stability in its growth potential, focused on North American and Western European customers.
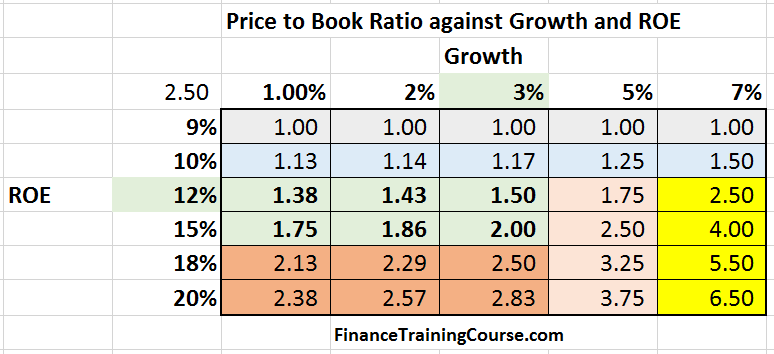
Even adjusting for the fact that Price to book is generally not a great indicator of value in technology companies, LNKD’s PB ratio the day before the deal was announced was 3.75x. For MSFT that number has been 5x but that is understandable given the substantial hoard of undervalued IP MSFT rests on. But a 5.675x multiple for LNKD implies a terminal growth rate of 7% and a target ROE north of 18%.
Unlike MSFT, for LNKD there is no case for undervalued IP and based on their history, direction and traction, a near impossibility of realizing a 20% ROE in coming years. Even with the full weight of the empire in Redmond behind them. While MSFT may be able to generate synergies and cross selling opportunities, the question is will these synergies actually generate implied target rates in perpetuity.
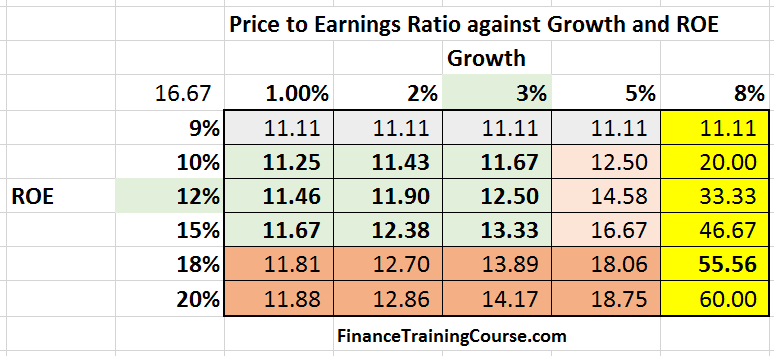
Price to Earnings.
For Price to earnings, we take the same formula used for PB and multiply it with the inverse of ROE.

Similar to our Price to Book ratio grid, we generate a Price to earnings grid.
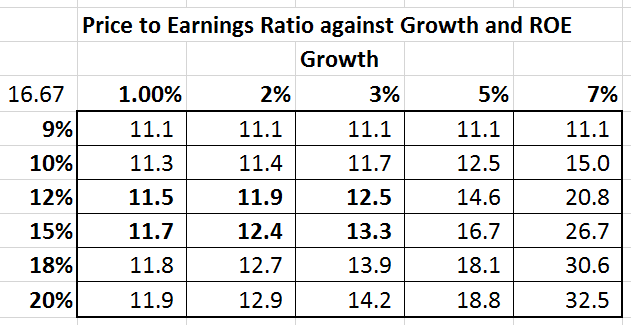
The multiple MSFT paid for LNKD (54 time projected forward earnings) is not even on the original grid. But no worries. We hack our excel sheet to get the number we want and end up with a revised grid below that includes the figure in its range.
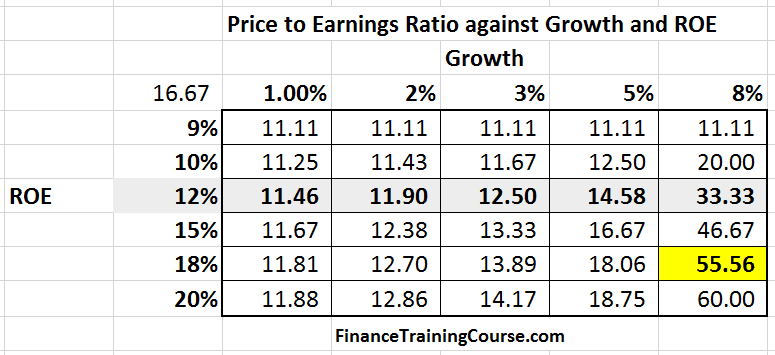
To earn a multiple of roughly 55 times, LNKD would need to earn an ROE in perpetuity of 18% with a terminal growth rate of 8%. Year on year. If they could pull that stunt this acquisition would be accretive. Unfortunately the 18% ROE and 8% terminal growth cell lies in the not bloody likely territory as far as rationale thinking goes. See the color coded grid below and the color key above.
Who is the real winner here? MSFT or LNKD?
While lofty valuation multiples seem to be plucked out of thin air, gravity is still very much at work. There is an underlying formula that can allow you to discern between assumptions that are realistic and reasonable versus those that are border line delusional. You can’t take two boring companies growing at below par rates and earning below par returns, mix them up, and expect them to overnight magically transform into super stars riding high octane fuel.
While there is some basis to the synergies behind LNKD’s magic MAU (Monthly Active Users) figures, you have to revisit one key fact. LNKD has essentially been directionless this last year. Their new platform strategy has been a disaster as far as user retention and activity is concerned. Ask yourself a simple question, as a LNKD user how much time have you spent on the site recently? Do you like it? How does that compare to the amount you used to spend on it two years ago?
In January 1998, Microsoft announced the acquisition of hotmail. For hotmail’s 9 million users Microsoft paid US$500 million, roughly US$ 50 per user when the term MAU was barely used or understood. The problem with MSFT LNKD is that Redmond is treating LNKD as another hotmail. Hotmail transformed and rebooted MSN. LNKD is unlikely to do so.
A year down the road when we look back at this transaction we will note that this was Reid Hoffman‘s finest moment. For Satya Nadella, I hope the historian in question is kind, generous and gentle.
References
- http://www.wsj.com/articles/why-microsoft-gave-linkedin-a-big-promotion-1465842607?mod=wsj_nview_latest
- http://financials.morningstar.com/ratios/r.html?t=MSFT
- http://financials.morningstar.com/ratios/r.html?t=LNKD
- Microsoft Linkedin transaction official announcement slidedeck – 13-June-2016
- IMF-Global-Growth-Forecasts-Jan-16
- The Bank Financial Analyst Handbook, Frost, 2007.
- Microsoft acquisitions over the years.